29
/
en
AIzaSyAYiBZKx7MnpbEhh9jyipgxe19OcubqV5w
April 1, 2024
217210
Pakistan
PAK
true
2
1
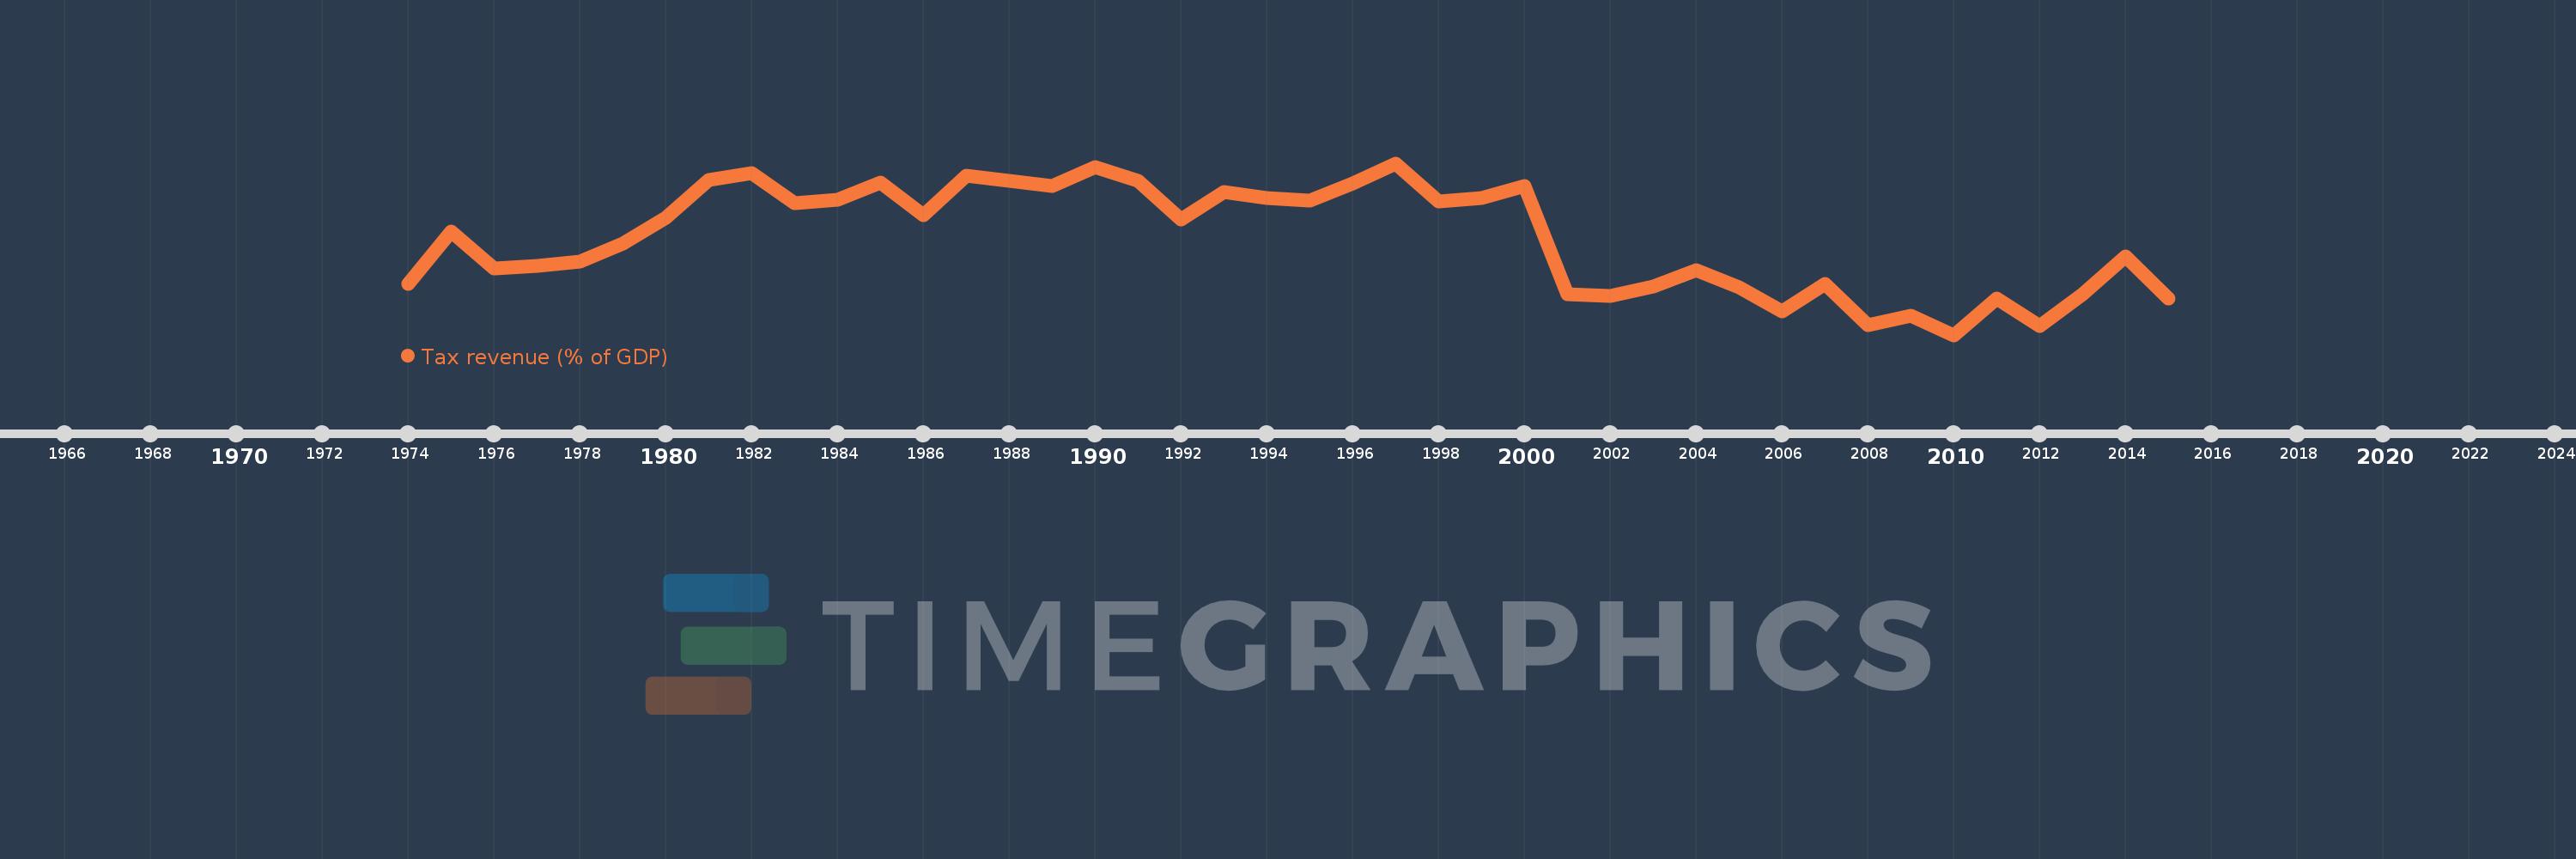
Tax revenue (% of GDP)
2015,2014,2013,2012,2011,2010,2009,2008,2007,2006,2005,2004,2003,2002,2001,2000,1999,1998,1997,1996,1995,1994,1993,1992,1991,1990,1989,1987,1986,1985,1984,1983,1982,1981,1980,1979,1978,1977,1976,1975,1974
This statistics in other country:
AfghanistanAlbaniaAlgeriaAngolaAntigua and BarbudaArgentinaArmeniaAustraliaAustriaAzerbaijanBahamas, TheBahrainBangladeshBarbadosBelarusBelgiumBelizeBeninBhutanBoliviaBosnia and HerzegovinaBotswanaBrazilBulgariaBurkina FasoBurundiCabo VerdeCambodiaCanadaCaribbean small statesCentral African RepublicCentral Europe and the BalticsChileChinaColombiaCongo, Dem. Rep.Congo, Rep.Costa RicaCote d'IvoireCroatiaCyprusCzech RepublicDenmarkDominicaDominican RepublicEarly-demographic dividendEast Asia & PacificEast Asia & Pacific (excluding high income)East Asia & Pacific (IDA & IBRD countries)Egypt, Arab Rep.El SalvadorEquatorial GuineaEstoniaEthiopiaEuro areaEurope & Central AsiaEurope & Central Asia (excluding high income)Europe & Central Asia (IDA & IBRD countries)European UnionFijiFinlandFranceGambia, TheGeorgiaGermanyGhanaGreeceGrenadaGuatemalaHeavily indebted poor countries (HIPC)High incomeHondurasHong Kong SAR, ChinaHungaryIBRD onlyIcelandIDA & IBRD totalIDA blendIDA onlyIDA totalIndiaIndonesiaIran, Islamic Rep.IraqIrelandIsraelItalyJamaicaJapanJordanKazakhstanKenyaKiribatiKorea, Rep.KuwaitKyrgyz RepublicLao PDRLate-demographic dividendLatin America & Caribbean Latin America & Caribbean (excluding high income)Latin America & the Caribbean (IDA & IBRD countries)LatviaLeast developed countries: UN classificationLebanonLesothoLiberiaLithuaniaLow & middle incomeLow incomeLower middle incomeLuxembourgMacao SAR, ChinaMacedonia, FYRMadagascarMalawiMalaysiaMaldivesMaliMaltaMauritiusMexicoMicronesia, Fed. Sts.Middle East & North Africa (excluding high income)Middle East & North Africa (IDA & IBRD countries)Middle incomeMoldovaMongoliaMoroccoMozambiqueMyanmarNamibiaNepalNetherlandsNew ZealandNicaraguaNigeriaNorth AmericaNorwayOECD membersOmanOther small statesPacific island small statesPakistanPanamaPapua New GuineaParaguayPeruPhilippinesPolandPortugalPost-demographic dividendPre-demographic dividendQatarRomaniaRussian FederationRwandaSamoaSan MarinoSao Tome and PrincipeSenegalSerbiaSeychellesSierra LeoneSingaporeSlovak RepublicSloveniaSmall statesSolomon IslandsSouth AfricaSouth AsiaSouth Asia (IDA & IBRD)SpainSri LankaSt. Kitts and NevisSt. LuciaSt. Vincent and the GrenadinesSub-Saharan Africa Sub-Saharan Africa (excluding high income)Sub-Saharan Africa (IDA & IBRD countries)SurinameSwazilandSwedenSwitzerlandSyrian Arab RepublicTajikistanTanzaniaThailandTimor-LesteTogoTrinidad and TobagoTunisiaTurkeyUgandaUkraineUnited Arab EmiratesUnited KingdomUnited StatesUpper middle incomeUruguayVanuatuVenezuela, RBVietnamWest Bank and GazaWorldYemen, Rep.ZambiaZimbabwe Timeline:
This timeline shows a graph from 1974 to 2015 of Pakistan. No data until 1973. Number of actual observations by date: 41.
Source name:
World Development Indicators
Source organization:
International Monetary Fund, Government Finance Statistics Yearbook and data files, and World Bank and OECD GDP estimates.
Categories, topics:
Public Sector
Last updated:
apr 23, 2017
Indicators value changes by year
Maximum:
13.815
jan 1, 1997
At the date of observation
Value
Absolute change
Change from previous value
jan 1, 1974
10.397
+10.397
0.0%
jan 1, 1975
11.875
+1.478
14.21%
jan 1, 1976
10.842
-1.033
-8.7%
jan 1, 1977
10.892
+0.05
0.46%
jan 1, 1978
11.022
+0.13
1.19%
jan 1, 1979
11.536
+0.514
4.67%
jan 1, 1980
12.272
+0.735
6.37%
jan 1, 1981
13.33
+1.059
8.63%
jan 1, 1982
13.534
+0.204
1.53%
jan 1, 1983
12.679
-0.856
-6.32%
jan 1, 1984
12.788
+0.11
0.87%
jan 1, 1985
13.268
+0.48
3.75%
jan 1, 1986
12.33
-0.939
-7.08%
jan 1, 1987
13.473
+1.143
9.27%
jan 1, 1989
13.171
-0.302
-2.24%
jan 1, 1990
13.708
+0.537
4.08%
jan 1, 1991
13.319
-0.389
-2.84%
jan 1, 1992
12.227
-1.092
-8.2%
jan 1, 1993
12.994
+0.767
6.28%
jan 1, 1994
12.826
-0.168
-1.29%
jan 1, 1995
12.752
-0.074
-0.58%
jan 1, 1996
13.249
+0.497
3.89%
jan 1, 1997
13.815
+0.567
4.28%
jan 1, 1998
12.742
-1.073
-7.77%
jan 1, 1999
12.829
+0.087
0.68%
jan 1, 2000
13.165
+0.336
2.62%
jan 1, 2001
10.089
-3.076
-23.37%
jan 1, 2002
10.043
-0.046
-0.46%
jan 1, 2003
10.311
+0.269
2.68%
jan 1, 2004
10.784
+0.473
4.58%
jan 1, 2005
10.285
-0.499
-4.63%
jan 1, 2006
9.604
-0.68
-6.61%
jan 1, 2007
10.385
+0.781
8.13%
jan 1, 2008
9.235
-1.151
-11.08%
jan 1, 2009
9.494
+0.259
2.8%
jan 1, 2010
8.943
-0.55
-5.8%
jan 1, 2011
9.975
+1.032
11.54%
jan 1, 2012
9.189
-0.787
-7.89%
jan 1, 2013
10.099
+0.911
9.91%
jan 1, 2014
11.184
+1.084
10.74%
jan 1, 2015
9.988
-1.196
-10.69%
Ranking of countries by current statistics by years


Comments: