29
/
en
AIzaSyAYiBZKx7MnpbEhh9jyipgxe19OcubqV5w
April 1, 2024
105510
Chile
CHL
true
2
1
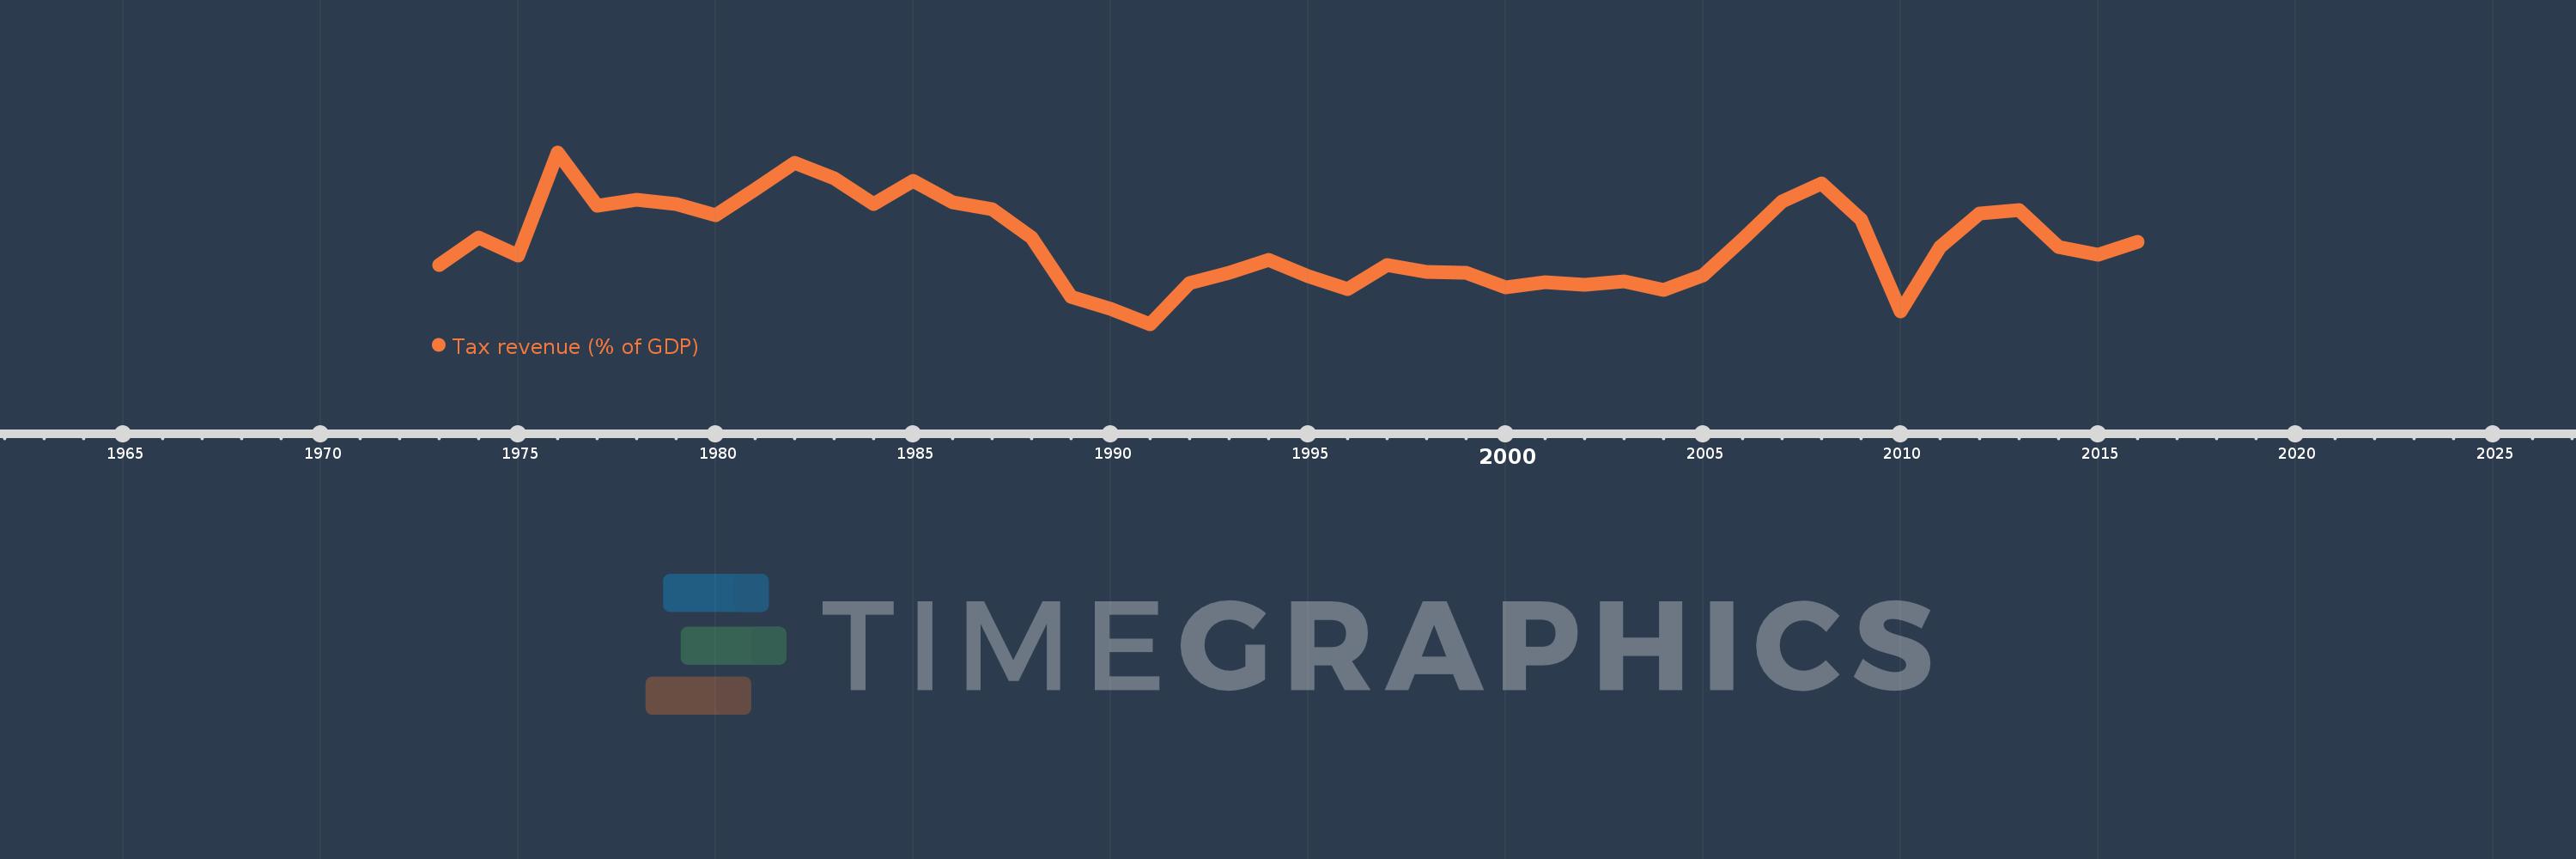
Tax revenue (% of GDP)
2016,2015,2014,2013,2012,2011,2010,2009,2008,2007,2006,2005,2004,2003,2002,2001,2000,1999,1998,1997,1996,1995,1994,1993,1992,1991,1990,1989,1988,1987,1986,1985,1984,1983,1982,1981,1980,1979,1978,1977,1976,1975,1974,1973
This statistics in other country:
AfghanistanAlbaniaAlgeriaAngolaAntigua and BarbudaArgentinaArmeniaAustraliaAustriaAzerbaijanBahamas, TheBahrainBangladeshBarbadosBelarusBelgiumBelizeBeninBhutanBoliviaBosnia and HerzegovinaBotswanaBrazilBulgariaBurkina FasoBurundiCabo VerdeCambodiaCanadaCaribbean small statesCentral African RepublicCentral Europe and the BalticsChileChinaColombiaCongo, Dem. Rep.Congo, Rep.Costa RicaCote d'IvoireCroatiaCyprusCzech RepublicDenmarkDominicaDominican RepublicEarly-demographic dividendEast Asia & PacificEast Asia & Pacific (excluding high income)East Asia & Pacific (IDA & IBRD countries)Egypt, Arab Rep.El SalvadorEquatorial GuineaEstoniaEthiopiaEuro areaEurope & Central AsiaEurope & Central Asia (excluding high income)Europe & Central Asia (IDA & IBRD countries)European UnionFijiFinlandFranceGambia, TheGeorgiaGermanyGhanaGreeceGrenadaGuatemalaHeavily indebted poor countries (HIPC)High incomeHondurasHong Kong SAR, ChinaHungaryIBRD onlyIcelandIDA & IBRD totalIDA blendIDA onlyIDA totalIndiaIndonesiaIran, Islamic Rep.IraqIrelandIsraelItalyJamaicaJapanJordanKazakhstanKenyaKiribatiKorea, Rep.KuwaitKyrgyz RepublicLao PDRLate-demographic dividendLatin America & Caribbean Latin America & Caribbean (excluding high income)Latin America & the Caribbean (IDA & IBRD countries)LatviaLeast developed countries: UN classificationLebanonLesothoLiberiaLithuaniaLow & middle incomeLow incomeLower middle incomeLuxembourgMacao SAR, ChinaMacedonia, FYRMadagascarMalawiMalaysiaMaldivesMaliMaltaMauritiusMexicoMicronesia, Fed. Sts.Middle East & North Africa (excluding high income)Middle East & North Africa (IDA & IBRD countries)Middle incomeMoldovaMongoliaMoroccoMozambiqueMyanmarNamibiaNepalNetherlandsNew ZealandNicaraguaNigeriaNorth AmericaNorwayOECD membersOmanOther small statesPacific island small statesPakistanPanamaPapua New GuineaParaguayPeruPhilippinesPolandPortugalPost-demographic dividendPre-demographic dividendQatarRomaniaRussian FederationRwandaSamoaSan MarinoSao Tome and PrincipeSenegalSerbiaSeychellesSierra LeoneSingaporeSlovak RepublicSloveniaSmall statesSolomon IslandsSouth AfricaSouth AsiaSouth Asia (IDA & IBRD)SpainSri LankaSt. Kitts and NevisSt. LuciaSt. Vincent and the GrenadinesSub-Saharan Africa Sub-Saharan Africa (excluding high income)Sub-Saharan Africa (IDA & IBRD countries)SurinameSwazilandSwedenSwitzerlandSyrian Arab RepublicTajikistanTanzaniaThailandTimor-LesteTogoTrinidad and TobagoTunisiaTurkeyUgandaUkraineUnited Arab EmiratesUnited KingdomUnited StatesUpper middle incomeUruguayVanuatuVenezuela, RBVietnamWest Bank and GazaWorldYemen, Rep.ZambiaZimbabwe Timeline:
This timeline shows a graph from 1973 to 2016 of Chile. No data until 1972. Number of actual observations by date: 44.
Source name:
World Development Indicators
Source organization:
International Monetary Fund, Government Finance Statistics Yearbook and data files, and World Bank and OECD GDP estimates.
Categories, topics:
Public Sector
Last updated:
apr 23, 2017
Indicators value changes by year
Minimum:
13.963
jan 1, 1991
Maximum:
21.729
jan 1, 1976
At the date of observation
Value
Absolute change
Change from previous value
jan 1, 1973
16.647
+16.647
0.0%
jan 1, 1974
17.887
+1.24
7.45%
jan 1, 1975
17.047
-0.84
-4.7%
jan 1, 1976
21.729
+4.683
27.47%
jan 1, 1977
19.302
-2.428
-11.17%
jan 1, 1978
19.603
+0.302
1.56%
jan 1, 1979
19.397
-0.206
-1.05%
jan 1, 1980
18.875
-0.522
-2.69%
jan 1, 1981
20.058
+1.183
6.27%
jan 1, 1982
21.27
+1.212
6.04%
jan 1, 1983
20.554
-0.716
-3.37%
jan 1, 1984
19.402
-1.153
-5.61%
jan 1, 1985
20.434
+1.033
5.32%
jan 1, 1986
19.47
-0.965
-4.72%
jan 1, 1987
19.165
-0.305
-1.56%
jan 1, 1988
17.897
-1.268
-6.62%
jan 1, 1989
15.19
-2.706
-15.12%
jan 1, 1990
14.677
-0.513
-3.38%
jan 1, 1991
13.963
-0.714
-4.87%
jan 1, 1992
15.818
+1.855
13.28%
jan 1, 1993
16.273
+0.455
2.88%
jan 1, 1994
16.863
+0.591
3.63%
jan 1, 1995
16.15
-0.713
-4.23%
jan 1, 1996
15.545
-0.605
-3.75%
jan 1, 1997
16.655
+1.11
7.14%
jan 1, 1998
16.338
-0.318
-1.91%
jan 1, 1999
16.292
-0.045
-0.28%
jan 1, 2000
15.633
-0.659
-4.05%
jan 1, 2001
15.854
+0.221
1.41%
jan 1, 2002
15.733
-0.121
-0.76%
jan 1, 2003
15.917
+0.184
1.17%
jan 1, 2004
15.499
-0.418
-2.63%
jan 1, 2005
16.171
+0.672
4.33%
jan 1, 2006
17.817
+1.646
10.18%
jan 1, 2007
19.507
+1.69
9.49%
jan 1, 2008
20.318
+0.812
4.16%
jan 1, 2009
18.713
-1.605
-7.9%
jan 1, 2010
14.56
-4.153
-22.2%
jan 1, 2011
17.436
+2.877
19.76%
jan 1, 2012
18.966
+1.529
8.77%
jan 1, 2013
19.13
+0.165
0.87%
jan 1, 2014
17.469
-1.661
-8.68%
jan 1, 2015
17.089
-0.38
-2.18%
jan 1, 2016
17.67
+0.581
3.4%
Ranking of countries by current statistics by years


Comments: