29
/
en
AIzaSyAYiBZKx7MnpbEhh9jyipgxe19OcubqV5w
April 1, 2024
37077
IBRD only
IBD
false
2
1
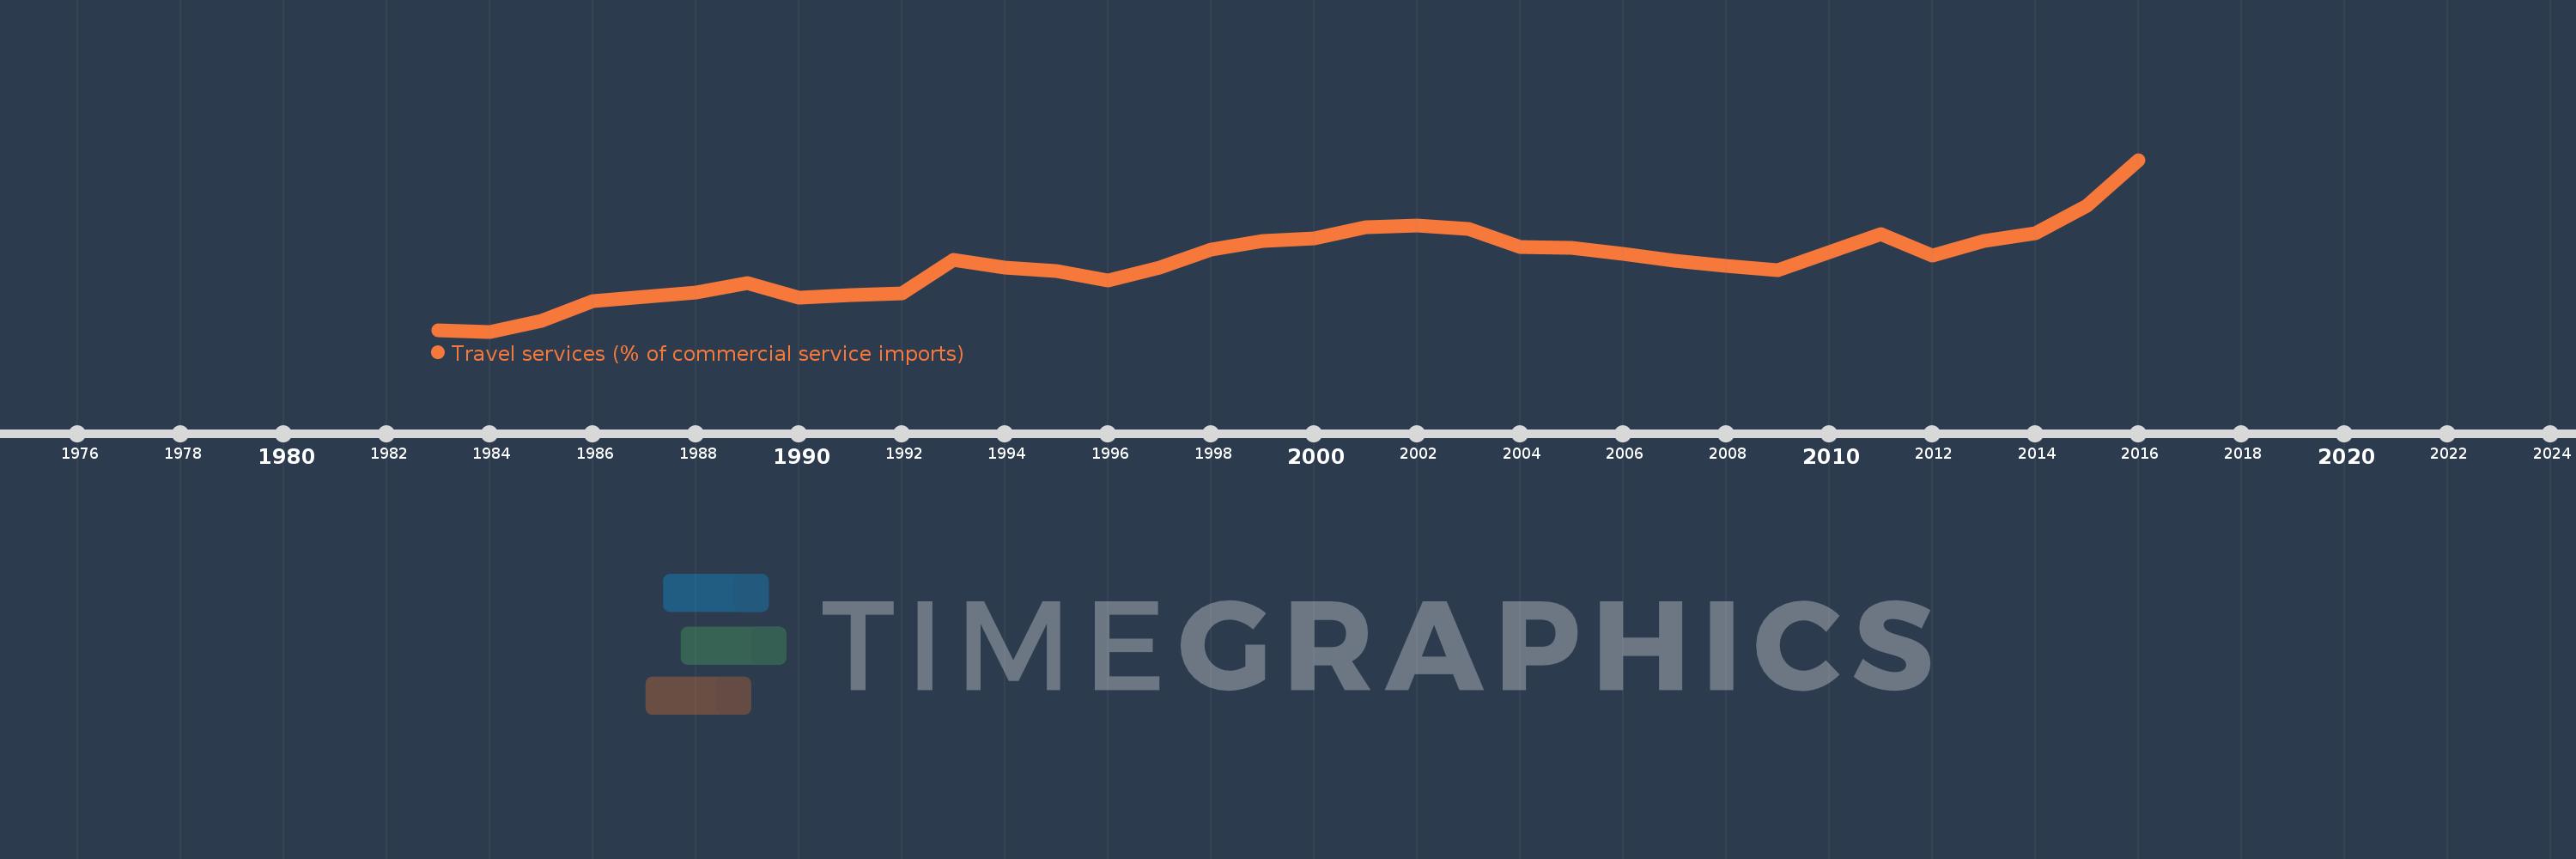
Travel services (% of commercial service imports)
2016,2015,2014,2013,2012,2011,2010,2009,2008,2007,2006,2005,2004,2003,2002,2001,2000,1999,1998,1997,1996,1995,1994,1993,1992,1991,1990,1989,1988,1987,1986,1985,1984,1983
This statistics in other country:
AfghanistanAlbaniaAlgeriaAngolaAntigua and BarbudaArab WorldArgentinaArmeniaArubaAustraliaAustriaAzerbaijanBahamas, TheBahrainBangladeshBarbadosBelarusBelgiumBelizeBeninBermudaBhutanBoliviaBosnia and HerzegovinaBotswanaBrazilBrunei DarussalamBulgariaBurkina FasoBurundiCabo VerdeCambodiaCameroonCanadaCaribbean small statesCentral African RepublicCentral Europe and the BalticsChadChileChinaColombiaComorosCongo, Dem. Rep.Congo, Rep.Costa RicaCote d'IvoireCroatiaCuracaoCyprusCzech RepublicDenmarkDjiboutiDominicaDominican RepublicEarly-demographic dividendEast Asia & PacificEast Asia & Pacific (excluding high income)East Asia & Pacific (IDA & IBRD countries)EcuadorEgypt, Arab Rep.El SalvadorEritreaEstoniaEthiopiaEuro areaEurope & Central AsiaEurope & Central Asia (excluding high income)Europe & Central Asia (IDA & IBRD countries)European UnionFaroe IslandsFijiFinlandFragile and conflict affected situationsFranceFrench PolynesiaGabonGambia, TheGeorgiaGermanyGhanaGreeceGrenadaGuatemalaGuineaGuinea-BissauGuyanaHaitiHeavily indebted poor countries (HIPC)High incomeHondurasHong Kong SAR, ChinaHungaryIBRD onlyIcelandIDA & IBRD totalIDA onlyIDA totalIndiaIndonesiaIran, Islamic Rep.IraqIrelandIsraelItalyJamaicaJapanJordanKazakhstanKenyaKiribatiKorea, Rep.KosovoKuwaitKyrgyz RepublicLao PDRLate-demographic dividendLatin America & Caribbean Latin America & Caribbean (excluding high income)Latin America & the Caribbean (IDA & IBRD countries)LatviaLeast developed countries: UN classificationLebanonLesothoLiberiaLibyaLithuaniaLow & middle incomeLow incomeLower middle incomeLuxembourgMacao SAR, ChinaMacedonia, FYRMadagascarMalawiMalaysiaMaldivesMaliMaltaMarshall IslandsMauritaniaMauritiusMexicoMicronesia, Fed. Sts.Middle East & North AfricaMiddle East & North Africa (excluding high income)Middle East & North Africa (IDA & IBRD countries)Middle incomeMoldovaMongoliaMontenegroMoroccoMozambiqueMyanmarNamibiaNepalNetherlandsNew CaledoniaNew ZealandNicaraguaNigerNigeriaNorth AmericaNorwayOECD membersOmanOther small statesPacific island small statesPakistanPalauPanamaPapua New GuineaParaguayPeruPhilippinesPolandPortugalPost-demographic dividendPre-demographic dividendQatarRomaniaRussian FederationRwandaSamoaSao Tome and PrincipeSaudi ArabiaSenegalSerbiaSeychellesSierra LeoneSingaporeSint Maarten (Dutch part)Slovak RepublicSloveniaSmall statesSolomon IslandsSouth AfricaSouth AsiaSouth Asia (IDA & IBRD)South SudanSpainSri LankaSt. Kitts and NevisSt. LuciaSt. Vincent and the GrenadinesSub-Saharan Africa Sub-Saharan Africa (excluding high income)Sub-Saharan Africa (IDA & IBRD countries)SudanSurinameSwazilandSwedenSwitzerlandSyrian Arab RepublicTajikistanTanzaniaThailandTimor-LesteTogoTongaTrinidad and TobagoTunisiaTurkeyTuvaluUgandaUkraineUnited KingdomUnited StatesUpper middle incomeUruguayVanuatuVenezuela, RBWest Bank and GazaWorldYemen, Rep.ZambiaZimbabwe Timeline:
This timeline shows a graph from 1983 to 2016 of IBRD only. No data until 1982. Number of actual observations by date: 34.
Source name:
World Development Indicators
Source organization:
International Monetary Fund, Balance of Payments Statistics Yearbook and data files.
Categories, topics:
Private Sector, Trade
Last updated:
apr 23, 2017
Indicators value changes by year
Minimum:
13.126
jan 1, 1984
Maximum:
40.788
jan 1, 2016
At the date of observation
Value
Absolute change
Change from previous value
jan 1, 1983
13.318
+13.318
0.0%
jan 1, 1984
13.126
-0.192
-1.44%
jan 1, 1985
14.873
+1.747
13.31%
jan 1, 1986
18.036
+3.163
21.26%
jan 1, 1987
18.718
+0.682
3.78%
jan 1, 1988
19.485
+0.767
4.1%
jan 1, 1989
20.963
+1.478
7.58%
jan 1, 1990
18.582
-2.381
-11.36%
jan 1, 1991
19.045
+0.463
2.49%
jan 1, 1992
19.214
+0.17
0.89%
jan 1, 1993
24.681
+5.467
28.45%
jan 1, 1994
23.465
-1.216
-4.93%
jan 1, 1995
22.899
-0.566
-2.41%
jan 1, 1996
21.351
-1.548
-6.76%
jan 1, 1997
23.492
+2.141
10.03%
jan 1, 1998
26.286
+2.794
11.89%
jan 1, 1999
27.65
+1.364
5.19%
jan 1, 2000
28.121
+0.47
1.7%
jan 1, 2001
29.879
+1.759
6.25%
jan 1, 2002
30.22
+0.34
1.14%
jan 1, 2003
29.604
-0.615
-2.04%
jan 1, 2004
26.696
-2.908
-9.82%
jan 1, 2005
26.639
-0.058
-0.22%
jan 1, 2006
25.627
-1.012
-3.8%
jan 1, 2007
24.486
-1.141
-4.45%
jan 1, 2008
23.715
-0.772
-3.15%
jan 1, 2009
22.967
-0.748
-3.15%
jan 1, 2010
25.91
+2.943
12.82%
jan 1, 2011
28.835
+2.925
11.29%
jan 1, 2012
25.368
-3.466
-12.02%
jan 1, 2013
27.728
+2.36
9.3%
jan 1, 2014
28.898
+1.17
4.22%
jan 1, 2015
33.381
+4.483
15.51%
jan 1, 2016
40.788
+7.408
22.19%
Ranking of countries by current statistics by years


Comments: