29
/
en
AIzaSyAYiBZKx7MnpbEhh9jyipgxe19OcubqV5w
April 1, 2024
207559
Nepal
NPL
true
2
1
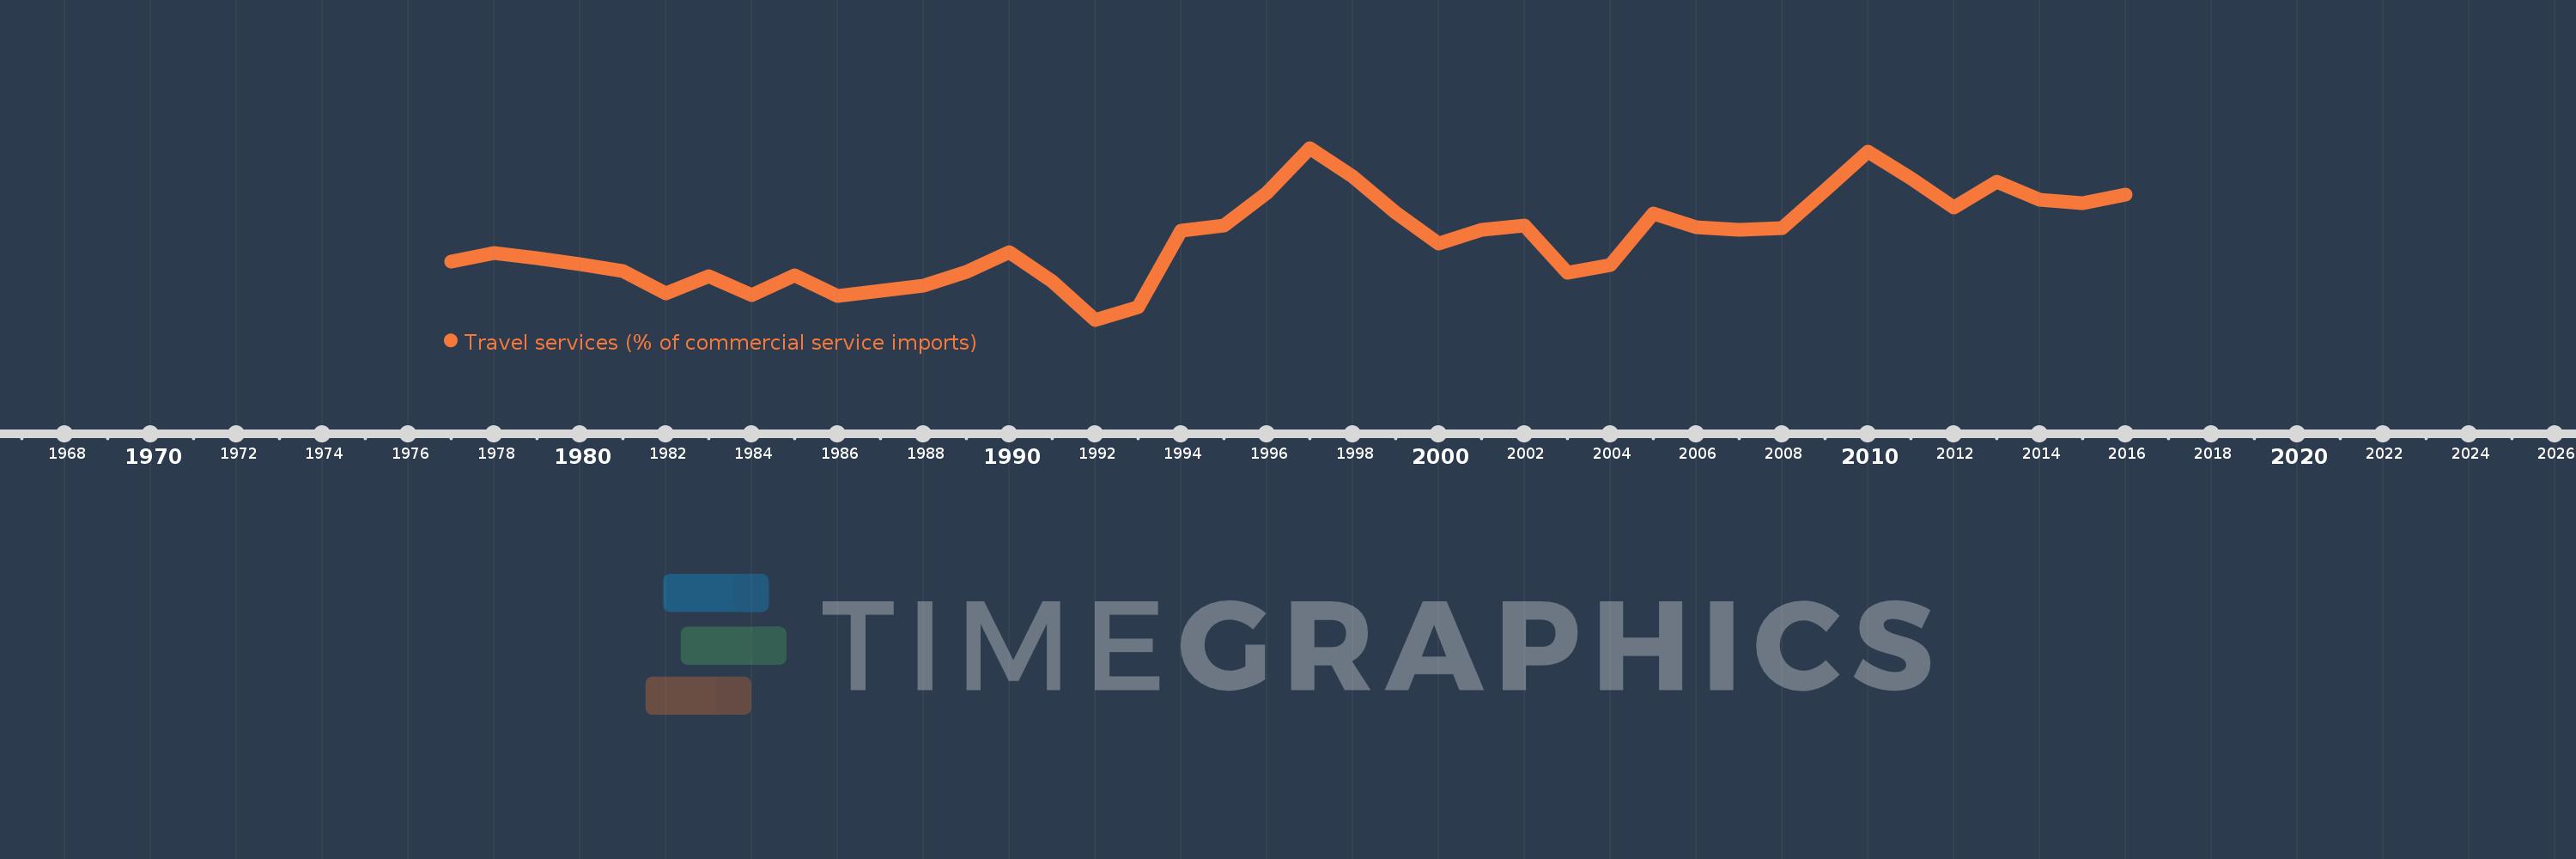
Travel services (% of commercial service imports)
2016,2015,2014,2013,2012,2011,2010,2009,2008,2007,2006,2005,2004,2003,2002,2001,2000,1999,1998,1997,1996,1995,1994,1993,1992,1991,1990,1989,1988,1987,1986,1985,1984,1983,1982,1981,1980,1979,1978,1977
This statistics in other country:
AfghanistanAlbaniaAlgeriaAngolaAntigua and BarbudaArab WorldArgentinaArmeniaArubaAustraliaAustriaAzerbaijanBahamas, TheBahrainBangladeshBarbadosBelarusBelgiumBelizeBeninBermudaBhutanBoliviaBosnia and HerzegovinaBotswanaBrazilBrunei DarussalamBulgariaBurkina FasoBurundiCabo VerdeCambodiaCameroonCanadaCaribbean small statesCentral African RepublicCentral Europe and the BalticsChadChileChinaColombiaComorosCongo, Dem. Rep.Congo, Rep.Costa RicaCote d'IvoireCroatiaCuracaoCyprusCzech RepublicDenmarkDjiboutiDominicaDominican RepublicEarly-demographic dividendEast Asia & PacificEast Asia & Pacific (excluding high income)East Asia & Pacific (IDA & IBRD countries)EcuadorEgypt, Arab Rep.El SalvadorEritreaEstoniaEthiopiaEuro areaEurope & Central AsiaEurope & Central Asia (excluding high income)Europe & Central Asia (IDA & IBRD countries)European UnionFaroe IslandsFijiFinlandFragile and conflict affected situationsFranceFrench PolynesiaGabonGambia, TheGeorgiaGermanyGhanaGreeceGrenadaGuatemalaGuineaGuinea-BissauGuyanaHaitiHeavily indebted poor countries (HIPC)High incomeHondurasHong Kong SAR, ChinaHungaryIBRD onlyIcelandIDA & IBRD totalIDA onlyIDA totalIndiaIndonesiaIran, Islamic Rep.IraqIrelandIsraelItalyJamaicaJapanJordanKazakhstanKenyaKiribatiKorea, Rep.KosovoKuwaitKyrgyz RepublicLao PDRLate-demographic dividendLatin America & Caribbean Latin America & Caribbean (excluding high income)Latin America & the Caribbean (IDA & IBRD countries)LatviaLeast developed countries: UN classificationLebanonLesothoLiberiaLibyaLithuaniaLow & middle incomeLow incomeLower middle incomeLuxembourgMacao SAR, ChinaMacedonia, FYRMadagascarMalawiMalaysiaMaldivesMaliMaltaMarshall IslandsMauritaniaMauritiusMexicoMicronesia, Fed. Sts.Middle East & North AfricaMiddle East & North Africa (excluding high income)Middle East & North Africa (IDA & IBRD countries)Middle incomeMoldovaMongoliaMontenegroMoroccoMozambiqueMyanmarNamibiaNepalNetherlandsNew CaledoniaNew ZealandNicaraguaNigerNigeriaNorth AmericaNorwayOECD membersOmanOther small statesPacific island small statesPakistanPalauPanamaPapua New GuineaParaguayPeruPhilippinesPolandPortugalPost-demographic dividendPre-demographic dividendQatarRomaniaRussian FederationRwandaSamoaSao Tome and PrincipeSaudi ArabiaSenegalSerbiaSeychellesSierra LeoneSingaporeSint Maarten (Dutch part)Slovak RepublicSloveniaSmall statesSolomon IslandsSouth AfricaSouth AsiaSouth Asia (IDA & IBRD)South SudanSpainSri LankaSt. Kitts and NevisSt. LuciaSt. Vincent and the GrenadinesSub-Saharan Africa Sub-Saharan Africa (excluding high income)Sub-Saharan Africa (IDA & IBRD countries)SudanSurinameSwazilandSwedenSwitzerlandSyrian Arab RepublicTajikistanTanzaniaThailandTimor-LesteTogoTongaTrinidad and TobagoTunisiaTurkeyTuvaluUgandaUkraineUnited KingdomUnited StatesUpper middle incomeUruguayVanuatuVenezuela, RBWest Bank and GazaWorldYemen, Rep.ZambiaZimbabwe Timeline:
This timeline shows a graph from 1977 to 2016 of Nepal. No data until 1976. Number of actual observations by date: 40.
Source name:
World Development Indicators
Source organization:
International Monetary Fund, Balance of Payments Statistics Yearbook and data files.
Categories, topics:
Private Sector, Trade
Last updated:
apr 23, 2017
Indicators value changes by year
Minimum:
21.298
jan 1, 1992
Maximum:
53.137
jan 1, 1997
At the date of observation
Value
Absolute change
Change from previous value
jan 1, 1977
32.126
+32.126
0.0%
jan 1, 1978
33.613
+1.486
4.63%
jan 1, 1979
32.638
-0.975
-2.9%
jan 1, 1980
31.583
-1.054
-3.23%
jan 1, 1981
30.376
-1.207
-3.82%
jan 1, 1982
26.164
-4.212
-13.87%
jan 1, 1983
29.326
+3.162
12.08%
jan 1, 1984
25.796
-3.529
-12.03%
jan 1, 1985
29.58
+3.784
14.67%
jan 1, 1986
25.726
-3.855
-13.03%
jan 1, 1987
26.662
+0.936
3.64%
jan 1, 1988
27.566
+0.904
3.39%
jan 1, 1989
30.235
+2.669
9.68%
jan 1, 1990
33.859
+3.624
11.99%
jan 1, 1991
28.484
-5.375
-15.87%
jan 1, 1992
21.298
-7.186
-25.23%
jan 1, 1993
23.598
+2.3
10.8%
jan 1, 1994
37.728
+14.129
59.88%
jan 1, 1995
38.829
+1.101
2.92%
jan 1, 1996
44.738
+5.909
15.22%
jan 1, 1997
53.137
+8.398
18.77%
jan 1, 1998
47.865
-5.272
-9.92%
jan 1, 1999
41.18
-6.685
-13.97%
jan 1, 2000
35.351
-5.828
-14.15%
jan 1, 2001
37.94
+2.589
7.32%
jan 1, 2002
38.834
+0.894
2.36%
jan 1, 2003
29.943
-8.891
-22.89%
jan 1, 2004
31.501
+1.557
5.2%
jan 1, 2005
40.929
+9.428
29.93%
jan 1, 2006
38.505
-2.424
-5.92%
jan 1, 2007
37.944
-0.562
-1.46%
jan 1, 2008
38.208
+0.264
0.7%
jan 1, 2009
45.316
+7.108
18.6%
jan 1, 2010
52.394
+7.078
15.62%
jan 1, 2011
47.531
-4.862
-9.28%
jan 1, 2012
42.041
-5.49
-11.55%
jan 1, 2013
46.858
+4.817
11.46%
jan 1, 2014
43.475
-3.383
-7.22%
jan 1, 2015
42.928
-0.547
-1.26%
jan 1, 2016
44.559
+1.631
3.8%
Ranking of countries by current statistics by years


Comments: