29
/
en
AIzaSyAYiBZKx7MnpbEhh9jyipgxe19OcubqV5w
April 1, 2024
52318
North America
NAC
false
2
1
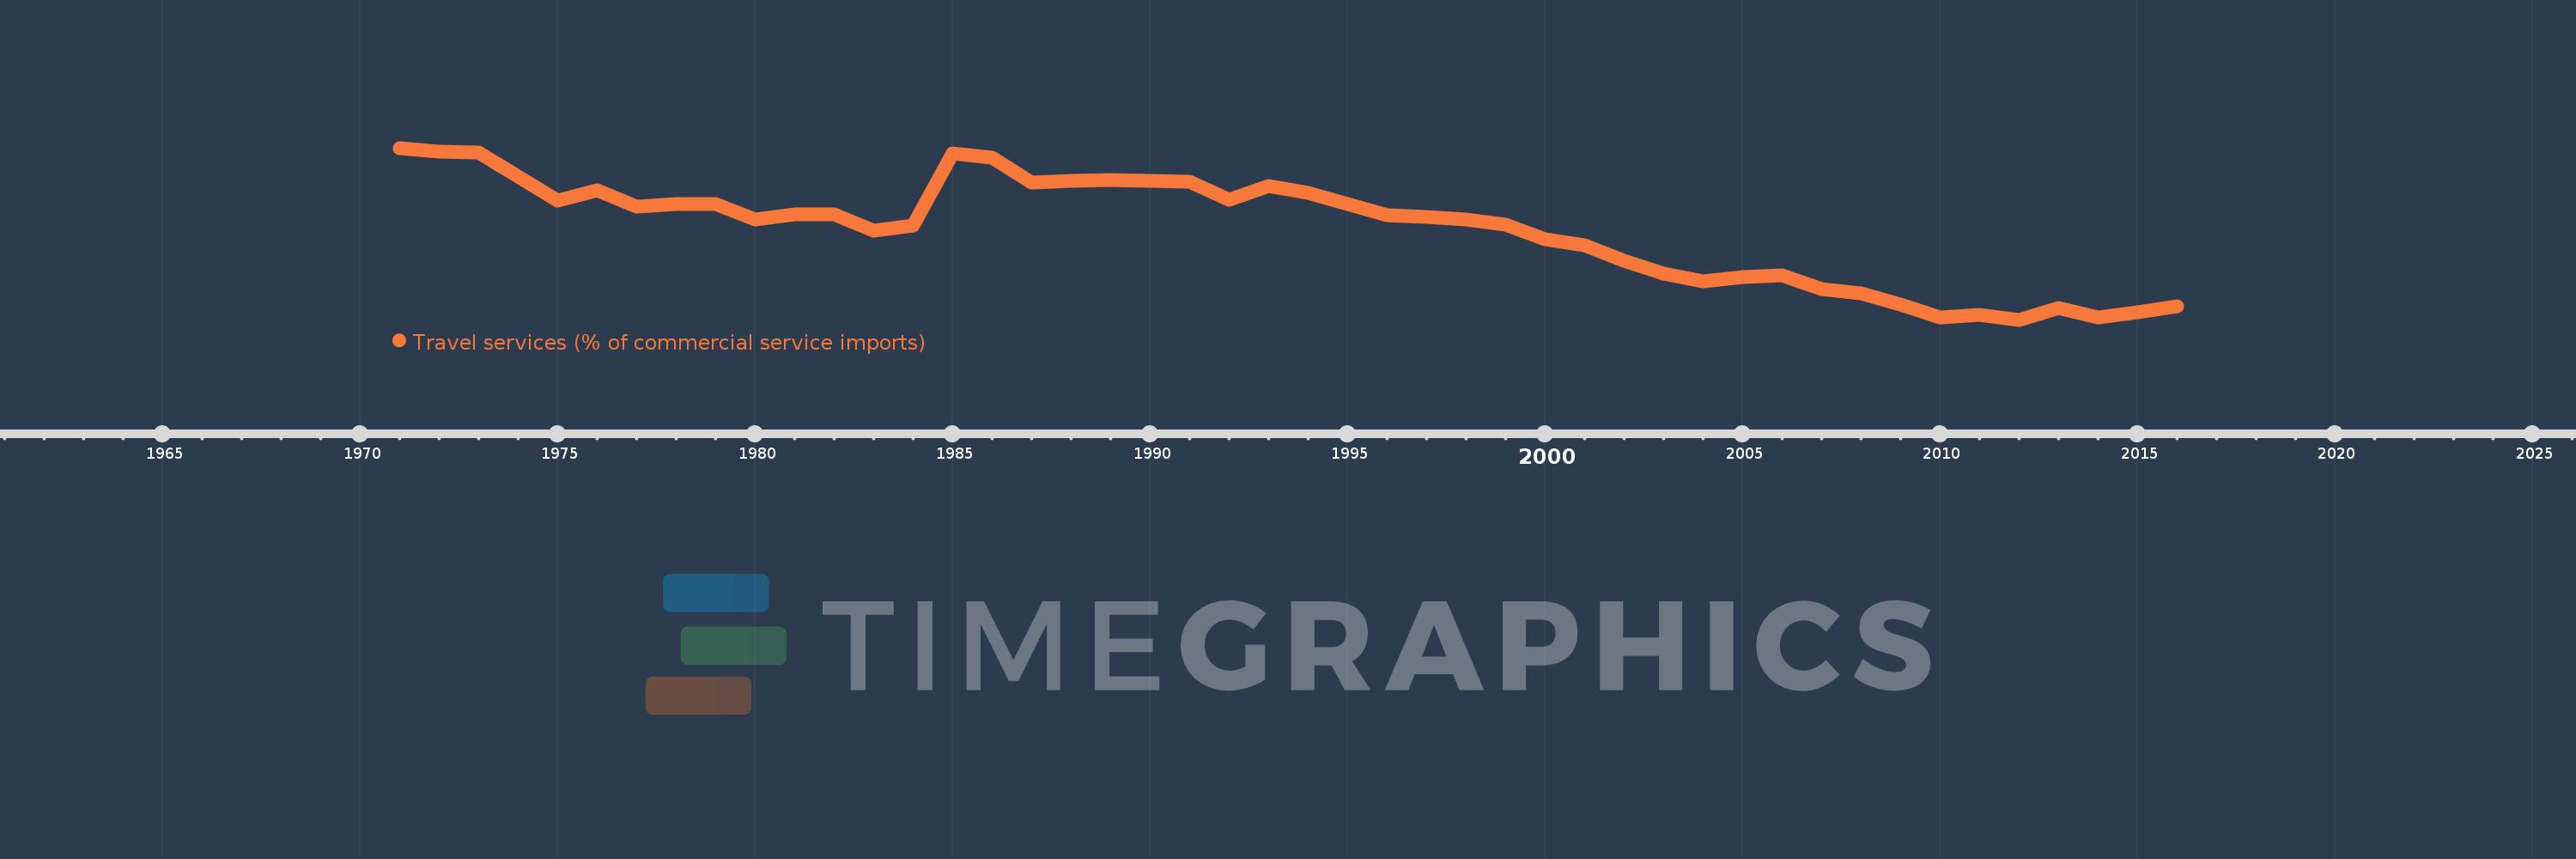
Travel services (% of commercial service imports)
2016,2015,2014,2013,2012,2011,2010,2009,2008,2007,2006,2005,2004,2003,2002,2001,2000,1999,1998,1997,1996,1995,1994,1993,1992,1991,1990,1989,1988,1987,1986,1985,1984,1983,1982,1981,1980,1979,1978,1977,1976,1975,1974,1973,1972,1971
This statistics in other country:
AfghanistanAlbaniaAlgeriaAngolaAntigua and BarbudaArab WorldArgentinaArmeniaArubaAustraliaAustriaAzerbaijanBahamas, TheBahrainBangladeshBarbadosBelarusBelgiumBelizeBeninBermudaBhutanBoliviaBosnia and HerzegovinaBotswanaBrazilBrunei DarussalamBulgariaBurkina FasoBurundiCabo VerdeCambodiaCameroonCanadaCaribbean small statesCentral African RepublicCentral Europe and the BalticsChadChileChinaColombiaComorosCongo, Dem. Rep.Congo, Rep.Costa RicaCote d'IvoireCroatiaCuracaoCyprusCzech RepublicDenmarkDjiboutiDominicaDominican RepublicEarly-demographic dividendEast Asia & PacificEast Asia & Pacific (excluding high income)East Asia & Pacific (IDA & IBRD countries)EcuadorEgypt, Arab Rep.El SalvadorEritreaEstoniaEthiopiaEuro areaEurope & Central AsiaEurope & Central Asia (excluding high income)Europe & Central Asia (IDA & IBRD countries)European UnionFaroe IslandsFijiFinlandFragile and conflict affected situationsFranceFrench PolynesiaGabonGambia, TheGeorgiaGermanyGhanaGreeceGrenadaGuatemalaGuineaGuinea-BissauGuyanaHaitiHeavily indebted poor countries (HIPC)High incomeHondurasHong Kong SAR, ChinaHungaryIBRD onlyIcelandIDA & IBRD totalIDA onlyIDA totalIndiaIndonesiaIran, Islamic Rep.IraqIrelandIsraelItalyJamaicaJapanJordanKazakhstanKenyaKiribatiKorea, Rep.KosovoKuwaitKyrgyz RepublicLao PDRLate-demographic dividendLatin America & Caribbean Latin America & Caribbean (excluding high income)Latin America & the Caribbean (IDA & IBRD countries)LatviaLeast developed countries: UN classificationLebanonLesothoLiberiaLibyaLithuaniaLow & middle incomeLow incomeLower middle incomeLuxembourgMacao SAR, ChinaMacedonia, FYRMadagascarMalawiMalaysiaMaldivesMaliMaltaMarshall IslandsMauritaniaMauritiusMexicoMicronesia, Fed. Sts.Middle East & North AfricaMiddle East & North Africa (excluding high income)Middle East & North Africa (IDA & IBRD countries)Middle incomeMoldovaMongoliaMontenegroMoroccoMozambiqueMyanmarNamibiaNepalNetherlandsNew CaledoniaNew ZealandNicaraguaNigerNigeriaNorth AmericaNorwayOECD membersOmanOther small statesPacific island small statesPakistanPalauPanamaPapua New GuineaParaguayPeruPhilippinesPolandPortugalPost-demographic dividendPre-demographic dividendQatarRomaniaRussian FederationRwandaSamoaSao Tome and PrincipeSaudi ArabiaSenegalSerbiaSeychellesSierra LeoneSingaporeSint Maarten (Dutch part)Slovak RepublicSloveniaSmall statesSolomon IslandsSouth AfricaSouth AsiaSouth Asia (IDA & IBRD)South SudanSpainSri LankaSt. Kitts and NevisSt. LuciaSt. Vincent and the GrenadinesSub-Saharan Africa Sub-Saharan Africa (excluding high income)Sub-Saharan Africa (IDA & IBRD countries)SudanSurinameSwazilandSwedenSwitzerlandSyrian Arab RepublicTajikistanTanzaniaThailandTimor-LesteTogoTongaTrinidad and TobagoTunisiaTurkeyTuvaluUgandaUkraineUnited KingdomUnited StatesUpper middle incomeUruguayVanuatuVenezuela, RBWest Bank and GazaWorldYemen, Rep.ZambiaZimbabwe Timeline:
This timeline shows a graph from 1971 to 2016 of North America. No data until 1970. Number of actual observations by date: 46.
Source name:
World Development Indicators
Source organization:
International Monetary Fund, Balance of Payments Statistics Yearbook and data files.
Categories, topics:
Private Sector, Trade
Last updated:
apr 23, 2017
Indicators value changes by year
Minimum:
23.757
jan 1, 2012
Maximum:
42.808
jan 1, 1971
At the date of observation
Value
Absolute change
Change from previous value
jan 1, 1971
42.808
+42.808
0.0%
jan 1, 1972
42.4
-0.408
-0.95%
jan 1, 1973
42.312
-0.088
-0.21%
jan 1, 1974
39.601
-2.71
-6.41%
jan 1, 1975
36.992
-2.609
-6.59%
jan 1, 1976
38.1
+1.108
3.0%
jan 1, 1977
36.296
-1.805
-4.74%
jan 1, 1978
36.61
+0.314
0.87%
jan 1, 1979
36.55
-0.06
-0.16%
jan 1, 1980
34.908
-1.642
-4.49%
jan 1, 1981
35.453
+0.545
1.56%
jan 1, 1982
35.479
+0.026
0.07%
jan 1, 1983
33.648
-1.832
-5.16%
jan 1, 1984
34.174
+0.526
1.56%
jan 1, 1985
42.241
+8.067
23.61%
jan 1, 1986
41.715
-0.526
-1.25%
jan 1, 1987
39.0
-2.715
-6.51%
jan 1, 1988
39.135
+0.135
0.35%
jan 1, 1989
39.211
+0.076
0.19%
jan 1, 1990
39.153
-0.058
-0.15%
jan 1, 1991
39.099
-0.054
-0.14%
jan 1, 1992
37.062
-2.037
-5.21%
jan 1, 1993
38.608
+1.546
4.17%
jan 1, 1994
37.85
-0.758
-1.96%
jan 1, 1995
36.572
-1.277
-3.37%
jan 1, 1996
35.312
-1.26
-3.44%
jan 1, 1997
35.203
-0.109
-0.31%
jan 1, 1998
34.834
-0.369
-1.05%
jan 1, 1999
34.3
-0.534
-1.53%
jan 1, 2000
32.688
-1.612
-4.7%
jan 1, 2001
32.023
-0.665
-2.04%
jan 1, 2002
30.285
-1.738
-5.43%
jan 1, 2003
28.848
-1.437
-4.74%
jan 1, 2004
27.992
-0.856
-2.97%
jan 1, 2005
28.469
+0.477
1.7%
jan 1, 2006
28.718
+0.25
0.88%
jan 1, 2007
27.127
-1.591
-5.54%
jan 1, 2008
26.637
-0.49
-1.8%
jan 1, 2009
25.409
-1.229
-4.61%
jan 1, 2010
24.016
-1.392
-5.48%
jan 1, 2011
24.295
+0.279
1.16%
jan 1, 2012
23.757
-0.538
-2.21%
jan 1, 2013
25.018
+1.261
5.31%
jan 1, 2014
24.045
-0.973
-3.89%
jan 1, 2015
24.547
+0.501
2.09%
jan 1, 2016
25.287
+0.741
3.02%
Ranking of countries by current statistics by years


Comments: