29
/
en
AIzaSyAYiBZKx7MnpbEhh9jyipgxe19OcubqV5w
April 1, 2024
155449
India
IND
true
2
1
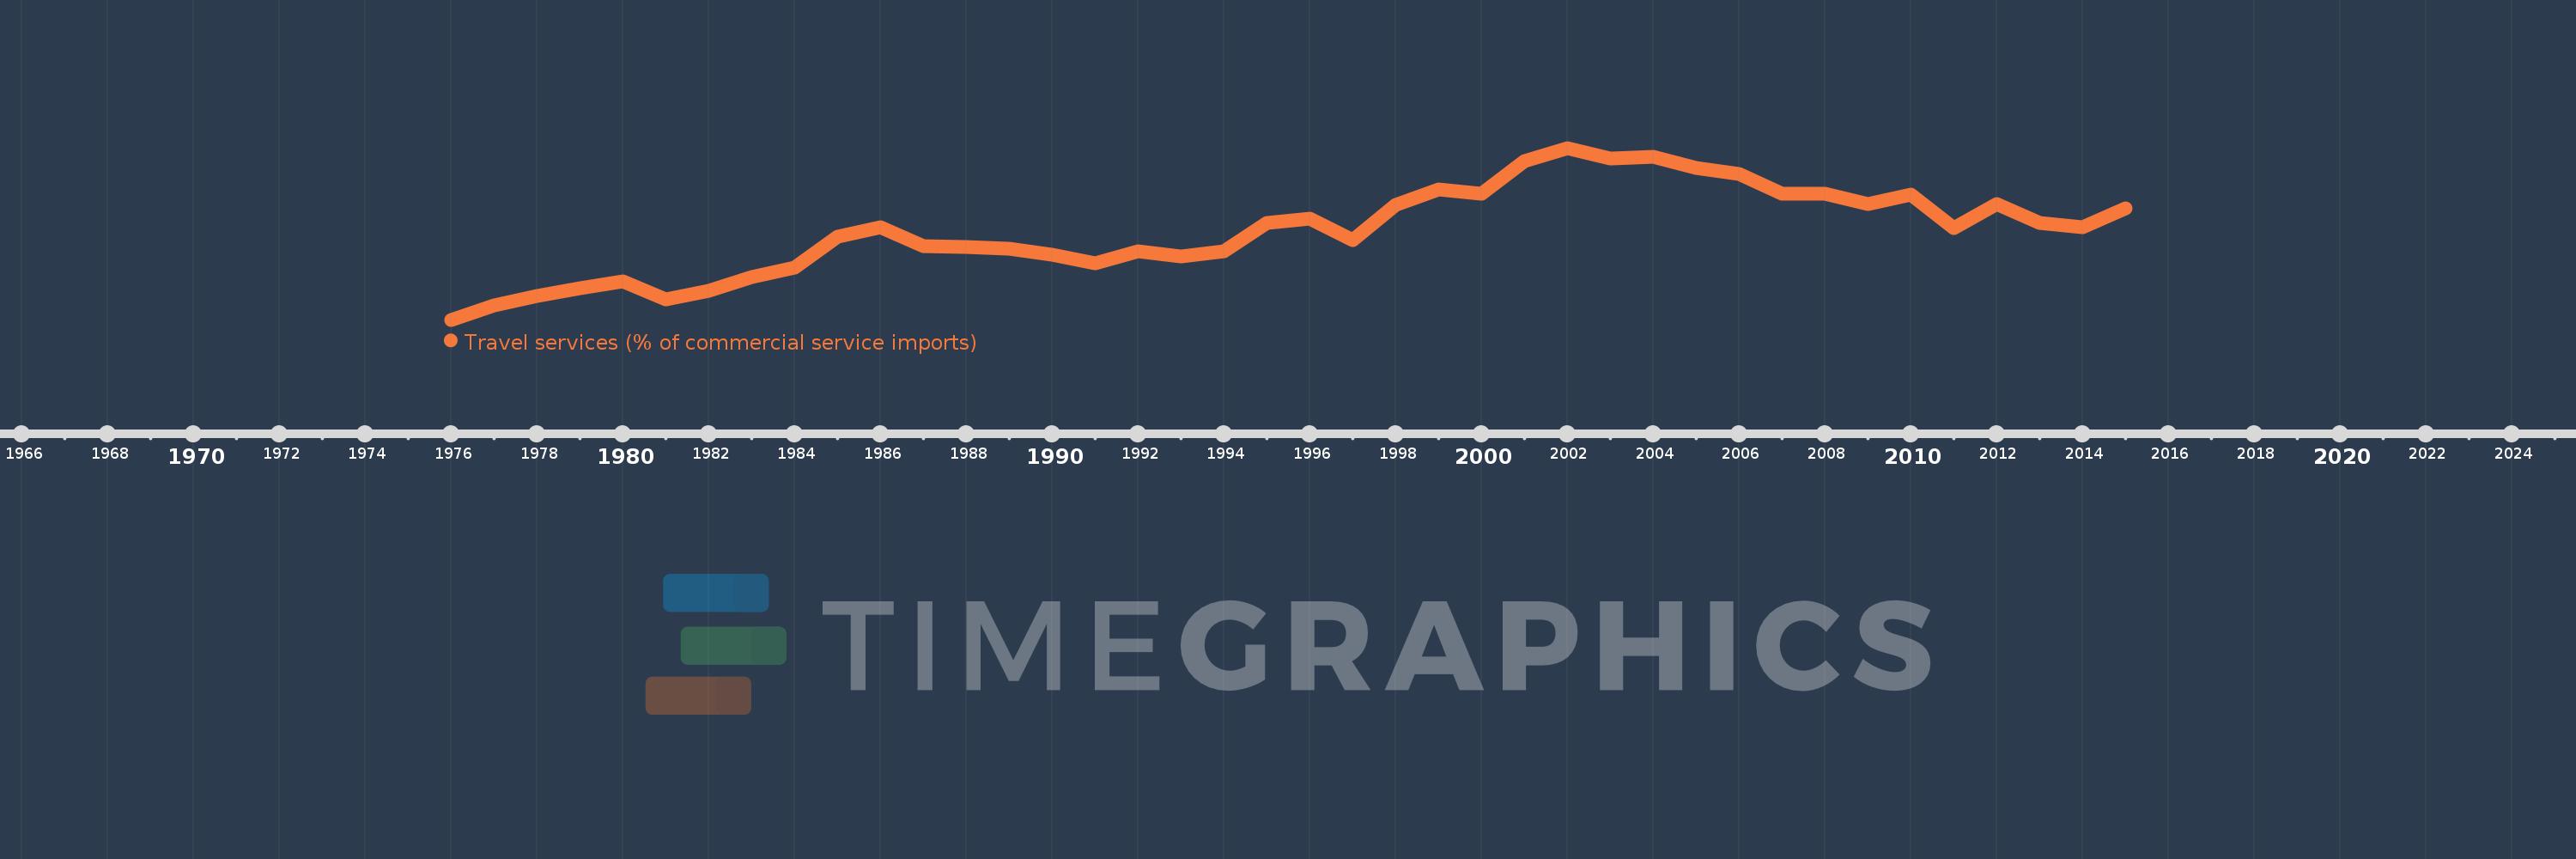
Travel services (% of commercial service imports)
2015,2014,2013,2012,2011,2010,2009,2008,2007,2006,2005,2004,2003,2002,2001,2000,1999,1998,1997,1996,1995,1994,1993,1992,1991,1990,1989,1988,1987,1986,1985,1984,1983,1982,1981,1980,1979,1978,1977,1976
This statistics in other country:
AfghanistanAlbaniaAlgeriaAngolaAntigua and BarbudaArab WorldArgentinaArmeniaArubaAustraliaAustriaAzerbaijanBahamas, TheBahrainBangladeshBarbadosBelarusBelgiumBelizeBeninBermudaBhutanBoliviaBosnia and HerzegovinaBotswanaBrazilBrunei DarussalamBulgariaBurkina FasoBurundiCabo VerdeCambodiaCameroonCanadaCaribbean small statesCentral African RepublicCentral Europe and the BalticsChadChileChinaColombiaComorosCongo, Dem. Rep.Congo, Rep.Costa RicaCote d'IvoireCroatiaCuracaoCyprusCzech RepublicDenmarkDjiboutiDominicaDominican RepublicEarly-demographic dividendEast Asia & PacificEast Asia & Pacific (excluding high income)East Asia & Pacific (IDA & IBRD countries)EcuadorEgypt, Arab Rep.El SalvadorEritreaEstoniaEthiopiaEuro areaEurope & Central AsiaEurope & Central Asia (excluding high income)Europe & Central Asia (IDA & IBRD countries)European UnionFaroe IslandsFijiFinlandFragile and conflict affected situationsFranceFrench PolynesiaGabonGambia, TheGeorgiaGermanyGhanaGreeceGrenadaGuatemalaGuineaGuinea-BissauGuyanaHaitiHeavily indebted poor countries (HIPC)High incomeHondurasHong Kong SAR, ChinaHungaryIBRD onlyIcelandIDA & IBRD totalIDA onlyIDA totalIndiaIndonesiaIran, Islamic Rep.IraqIrelandIsraelItalyJamaicaJapanJordanKazakhstanKenyaKiribatiKorea, Rep.KosovoKuwaitKyrgyz RepublicLao PDRLate-demographic dividendLatin America & Caribbean Latin America & Caribbean (excluding high income)Latin America & the Caribbean (IDA & IBRD countries)LatviaLeast developed countries: UN classificationLebanonLesothoLiberiaLibyaLithuaniaLow & middle incomeLow incomeLower middle incomeLuxembourgMacao SAR, ChinaMacedonia, FYRMadagascarMalawiMalaysiaMaldivesMaliMaltaMarshall IslandsMauritaniaMauritiusMexicoMicronesia, Fed. Sts.Middle East & North AfricaMiddle East & North Africa (excluding high income)Middle East & North Africa (IDA & IBRD countries)Middle incomeMoldovaMongoliaMontenegroMoroccoMozambiqueMyanmarNamibiaNepalNetherlandsNew CaledoniaNew ZealandNicaraguaNigerNigeriaNorth AmericaNorwayOECD membersOmanOther small statesPacific island small statesPakistanPalauPanamaPapua New GuineaParaguayPeruPhilippinesPolandPortugalPost-demographic dividendPre-demographic dividendQatarRomaniaRussian FederationRwandaSamoaSao Tome and PrincipeSaudi ArabiaSenegalSerbiaSeychellesSierra LeoneSingaporeSint Maarten (Dutch part)Slovak RepublicSloveniaSmall statesSolomon IslandsSouth AfricaSouth AsiaSouth Asia (IDA & IBRD)South SudanSpainSri LankaSt. Kitts and NevisSt. LuciaSt. Vincent and the GrenadinesSub-Saharan Africa Sub-Saharan Africa (excluding high income)Sub-Saharan Africa (IDA & IBRD countries)SudanSurinameSwazilandSwedenSwitzerlandSyrian Arab RepublicTajikistanTanzaniaThailandTimor-LesteTogoTongaTrinidad and TobagoTunisiaTurkeyTuvaluUgandaUkraineUnited KingdomUnited StatesUpper middle incomeUruguayVanuatuVenezuela, RBWest Bank and GazaWorldYemen, Rep.ZambiaZimbabwe Timeline:
This timeline shows a graph from 1976 to 2015 of India. No data until 1975. Number of actual observations by date: 40.
Source name:
World Development Indicators
Source organization:
International Monetary Fund, Balance of Payments Statistics Yearbook and data files.
Categories, topics:
Private Sector, Trade
Last updated:
apr 23, 2017
Indicators value changes by year
Maximum:
15.187
jan 1, 2002
At the date of observation
Value
Absolute change
Change from previous value
jan 1, 1976
2.39
+2.39
0.0%
jan 1, 1977
3.49
+1.099
45.98%
jan 1, 1978
4.164
+0.675
19.33%
jan 1, 1979
4.753
+0.589
14.15%
jan 1, 1980
5.278
+0.524
11.03%
jan 1, 1981
3.88
-1.398
-26.49%
jan 1, 1982
4.552
+0.673
17.34%
jan 1, 1983
5.581
+1.029
22.6%
jan 1, 1984
6.246
+0.665
11.92%
jan 1, 1985
8.562
+2.316
37.08%
jan 1, 1986
9.284
+0.722
8.44%
jan 1, 1987
7.889
-1.396
-15.03%
jan 1, 1988
7.784
-0.105
-1.33%
jan 1, 1989
7.686
-0.098
-1.26%
jan 1, 1990
7.249
-0.437
-5.69%
jan 1, 1991
6.616
-0.633
-8.73%
jan 1, 1992
7.481
+0.865
13.08%
jan 1, 1993
7.108
-0.373
-4.99%
jan 1, 1994
7.463
+0.356
5.01%
jan 1, 1995
9.571
+2.108
28.24%
jan 1, 1996
9.9
+0.329
3.44%
jan 1, 1997
8.299
-1.601
-16.17%
jan 1, 1998
10.928
+2.629
31.67%
jan 1, 1999
12.07
+1.143
10.46%
jan 1, 2000
11.791
-0.28
-2.32%
jan 1, 2001
14.237
+2.446
20.74%
jan 1, 2002
15.187
+0.951
6.68%
jan 1, 2003
14.383
-0.804
-5.3%
jan 1, 2004
14.526
+0.143
0.99%
jan 1, 2005
13.723
-0.803
-5.53%
jan 1, 2006
13.248
-0.475
-3.46%
jan 1, 2007
11.793
-1.454
-10.98%
jan 1, 2008
11.782
-0.011
-0.09%
jan 1, 2009
11.011
-0.771
-6.54%
jan 1, 2010
11.691
+0.68
6.18%
jan 1, 2011
9.198
-2.493
-21.32%
jan 1, 2012
11.03
+1.832
19.91%
jan 1, 2013
9.57
-1.46
-13.23%
jan 1, 2014
9.278
-0.293
-3.06%
jan 1, 2015
10.681
+1.404
15.13%
Ranking of countries by current statistics by years


Comments: