29
/
en
AIzaSyAYiBZKx7MnpbEhh9jyipgxe19OcubqV5w
April 1, 2024
280499
Vanuatu
VUT
true
2
1
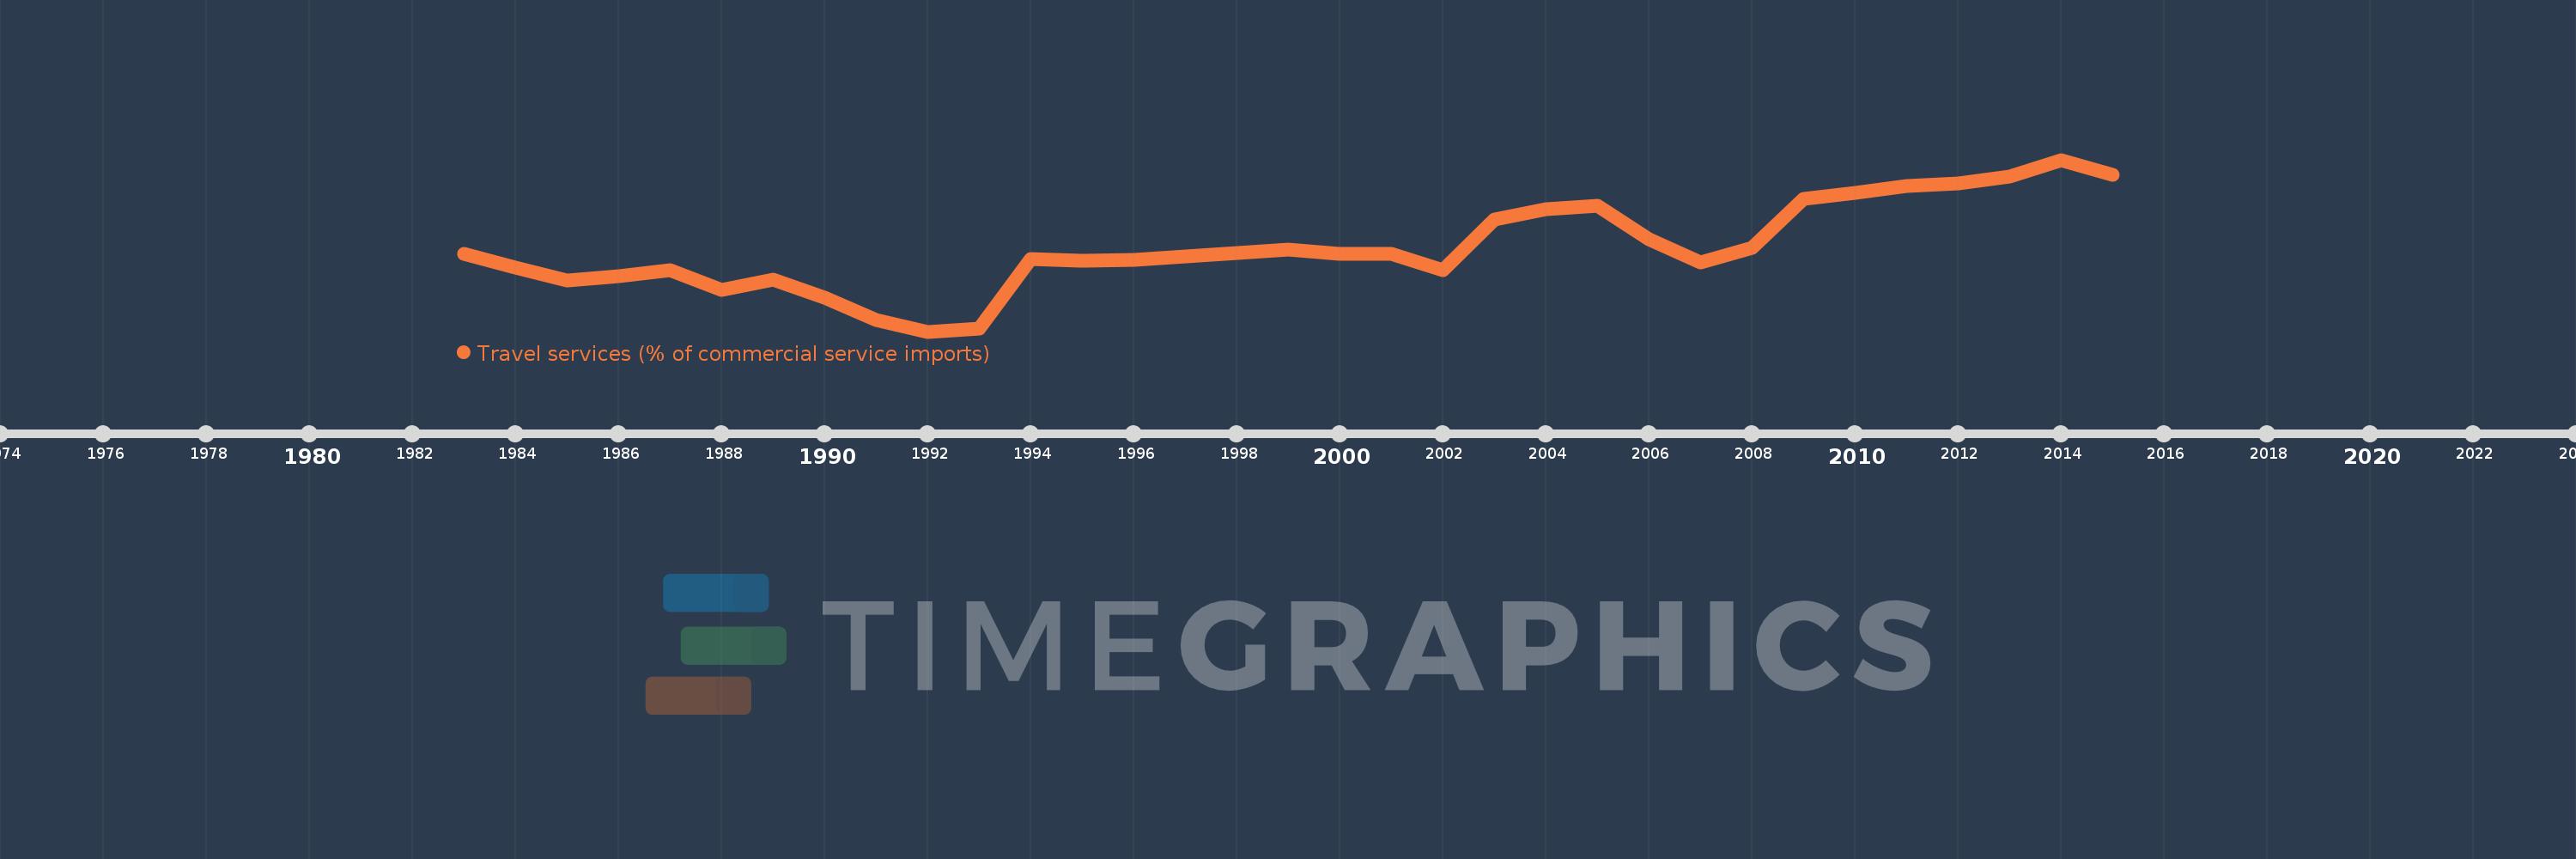
Travel services (% of commercial service imports)
2015,2014,2013,2012,2011,2010,2009,2008,2007,2006,2005,2004,2003,2002,2001,2000,1999,1998,1997,1996,1995,1994,1993,1992,1991,1990,1989,1988,1987,1986,1985,1984,1983
This statistics in other country:
AfghanistanAlbaniaAlgeriaAngolaAntigua and BarbudaArab WorldArgentinaArmeniaArubaAustraliaAustriaAzerbaijanBahamas, TheBahrainBangladeshBarbadosBelarusBelgiumBelizeBeninBermudaBhutanBoliviaBosnia and HerzegovinaBotswanaBrazilBrunei DarussalamBulgariaBurkina FasoBurundiCabo VerdeCambodiaCameroonCanadaCaribbean small statesCentral African RepublicCentral Europe and the BalticsChadChileChinaColombiaComorosCongo, Dem. Rep.Congo, Rep.Costa RicaCote d'IvoireCroatiaCuracaoCyprusCzech RepublicDenmarkDjiboutiDominicaDominican RepublicEarly-demographic dividendEast Asia & PacificEast Asia & Pacific (excluding high income)East Asia & Pacific (IDA & IBRD countries)EcuadorEgypt, Arab Rep.El SalvadorEritreaEstoniaEthiopiaEuro areaEurope & Central AsiaEurope & Central Asia (excluding high income)Europe & Central Asia (IDA & IBRD countries)European UnionFaroe IslandsFijiFinlandFragile and conflict affected situationsFranceFrench PolynesiaGabonGambia, TheGeorgiaGermanyGhanaGreeceGrenadaGuatemalaGuineaGuinea-BissauGuyanaHaitiHeavily indebted poor countries (HIPC)High incomeHondurasHong Kong SAR, ChinaHungaryIBRD onlyIcelandIDA & IBRD totalIDA onlyIDA totalIndiaIndonesiaIran, Islamic Rep.IraqIrelandIsraelItalyJamaicaJapanJordanKazakhstanKenyaKiribatiKorea, Rep.KosovoKuwaitKyrgyz RepublicLao PDRLate-demographic dividendLatin America & Caribbean Latin America & Caribbean (excluding high income)Latin America & the Caribbean (IDA & IBRD countries)LatviaLeast developed countries: UN classificationLebanonLesothoLiberiaLibyaLithuaniaLow & middle incomeLow incomeLower middle incomeLuxembourgMacao SAR, ChinaMacedonia, FYRMadagascarMalawiMalaysiaMaldivesMaliMaltaMarshall IslandsMauritaniaMauritiusMexicoMicronesia, Fed. Sts.Middle East & North AfricaMiddle East & North Africa (excluding high income)Middle East & North Africa (IDA & IBRD countries)Middle incomeMoldovaMongoliaMontenegroMoroccoMozambiqueMyanmarNamibiaNepalNetherlandsNew CaledoniaNew ZealandNicaraguaNigerNigeriaNorth AmericaNorwayOECD membersOmanOther small statesPacific island small statesPakistanPalauPanamaPapua New GuineaParaguayPeruPhilippinesPolandPortugalPost-demographic dividendPre-demographic dividendQatarRomaniaRussian FederationRwandaSamoaSao Tome and PrincipeSaudi ArabiaSenegalSerbiaSeychellesSierra LeoneSingaporeSint Maarten (Dutch part)Slovak RepublicSloveniaSmall statesSolomon IslandsSouth AfricaSouth AsiaSouth Asia (IDA & IBRD)South SudanSpainSri LankaSt. Kitts and NevisSt. LuciaSt. Vincent and the GrenadinesSub-Saharan Africa Sub-Saharan Africa (excluding high income)Sub-Saharan Africa (IDA & IBRD countries)SudanSurinameSwazilandSwedenSwitzerlandSyrian Arab RepublicTajikistanTanzaniaThailandTimor-LesteTogoTongaTrinidad and TobagoTunisiaTurkeyTuvaluUgandaUkraineUnited KingdomUnited StatesUpper middle incomeUruguayVanuatuVenezuela, RBWest Bank and GazaWorldYemen, Rep.ZambiaZimbabwe Timeline:
This timeline shows a graph from 1983 to 2015 of Vanuatu. No data until 1982. Number of actual observations by date: 33.
Source name:
World Development Indicators
Source organization:
International Monetary Fund, Balance of Payments Statistics Yearbook and data files.
Categories, topics:
Private Sector, Trade
Last updated:
apr 23, 2017
Indicators value changes by year
Maximum:
27.978
jan 1, 2014
At the date of observation
Value
Absolute change
Change from previous value
jan 1, 1983
14.213
+14.213
0.0%
jan 1, 1984
12.238
-1.976
-13.9%
jan 1, 1985
10.352
-1.885
-15.41%
jan 1, 1986
10.949
+0.597
5.76%
jan 1, 1987
11.811
+0.862
7.87%
jan 1, 1988
8.893
-2.918
-24.71%
jan 1, 1989
10.473
+1.581
17.77%
jan 1, 1990
7.861
-2.612
-24.94%
jan 1, 1991
4.504
-3.357
-42.7%
jan 1, 1992
2.842
-1.663
-36.92%
jan 1, 1993
3.246
+0.404
14.22%
jan 1, 1994
13.407
+10.161
313.06%
jan 1, 1995
13.169
-0.238
-1.78%
jan 1, 1996
13.283
+0.114
0.87%
jan 1, 1997
13.822
+0.539
4.06%
jan 1, 1998
14.311
+0.49
3.54%
jan 1, 1999
14.894
+0.582
4.07%
jan 1, 2000
14.262
-0.632
-4.24%
jan 1, 2001
14.24
-0.022
-0.16%
jan 1, 2002
11.833
-2.407
-16.9%
jan 1, 2003
19.202
+7.369
62.28%
jan 1, 2004
20.714
+1.512
7.87%
jan 1, 2005
21.259
+0.544
2.63%
jan 1, 2006
16.318
-4.94
-23.24%
jan 1, 2007
12.909
-3.409
-20.89%
jan 1, 2008
15.071
+2.162
16.75%
jan 1, 2009
22.295
+7.224
47.93%
jan 1, 2010
23.12
+0.825
3.7%
jan 1, 2011
24.166
+1.046
4.52%
jan 1, 2012
24.55
+0.385
1.59%
jan 1, 2013
25.565
+1.014
4.13%
jan 1, 2014
27.978
+2.413
9.44%
jan 1, 2015
25.745
-2.233
-7.98%
Ranking of countries by current statistics by years


Comments: