29
/
en
AIzaSyAYiBZKx7MnpbEhh9jyipgxe19OcubqV5w
April 1, 2024
240096
Sierra Leone
SLE
true
2
1
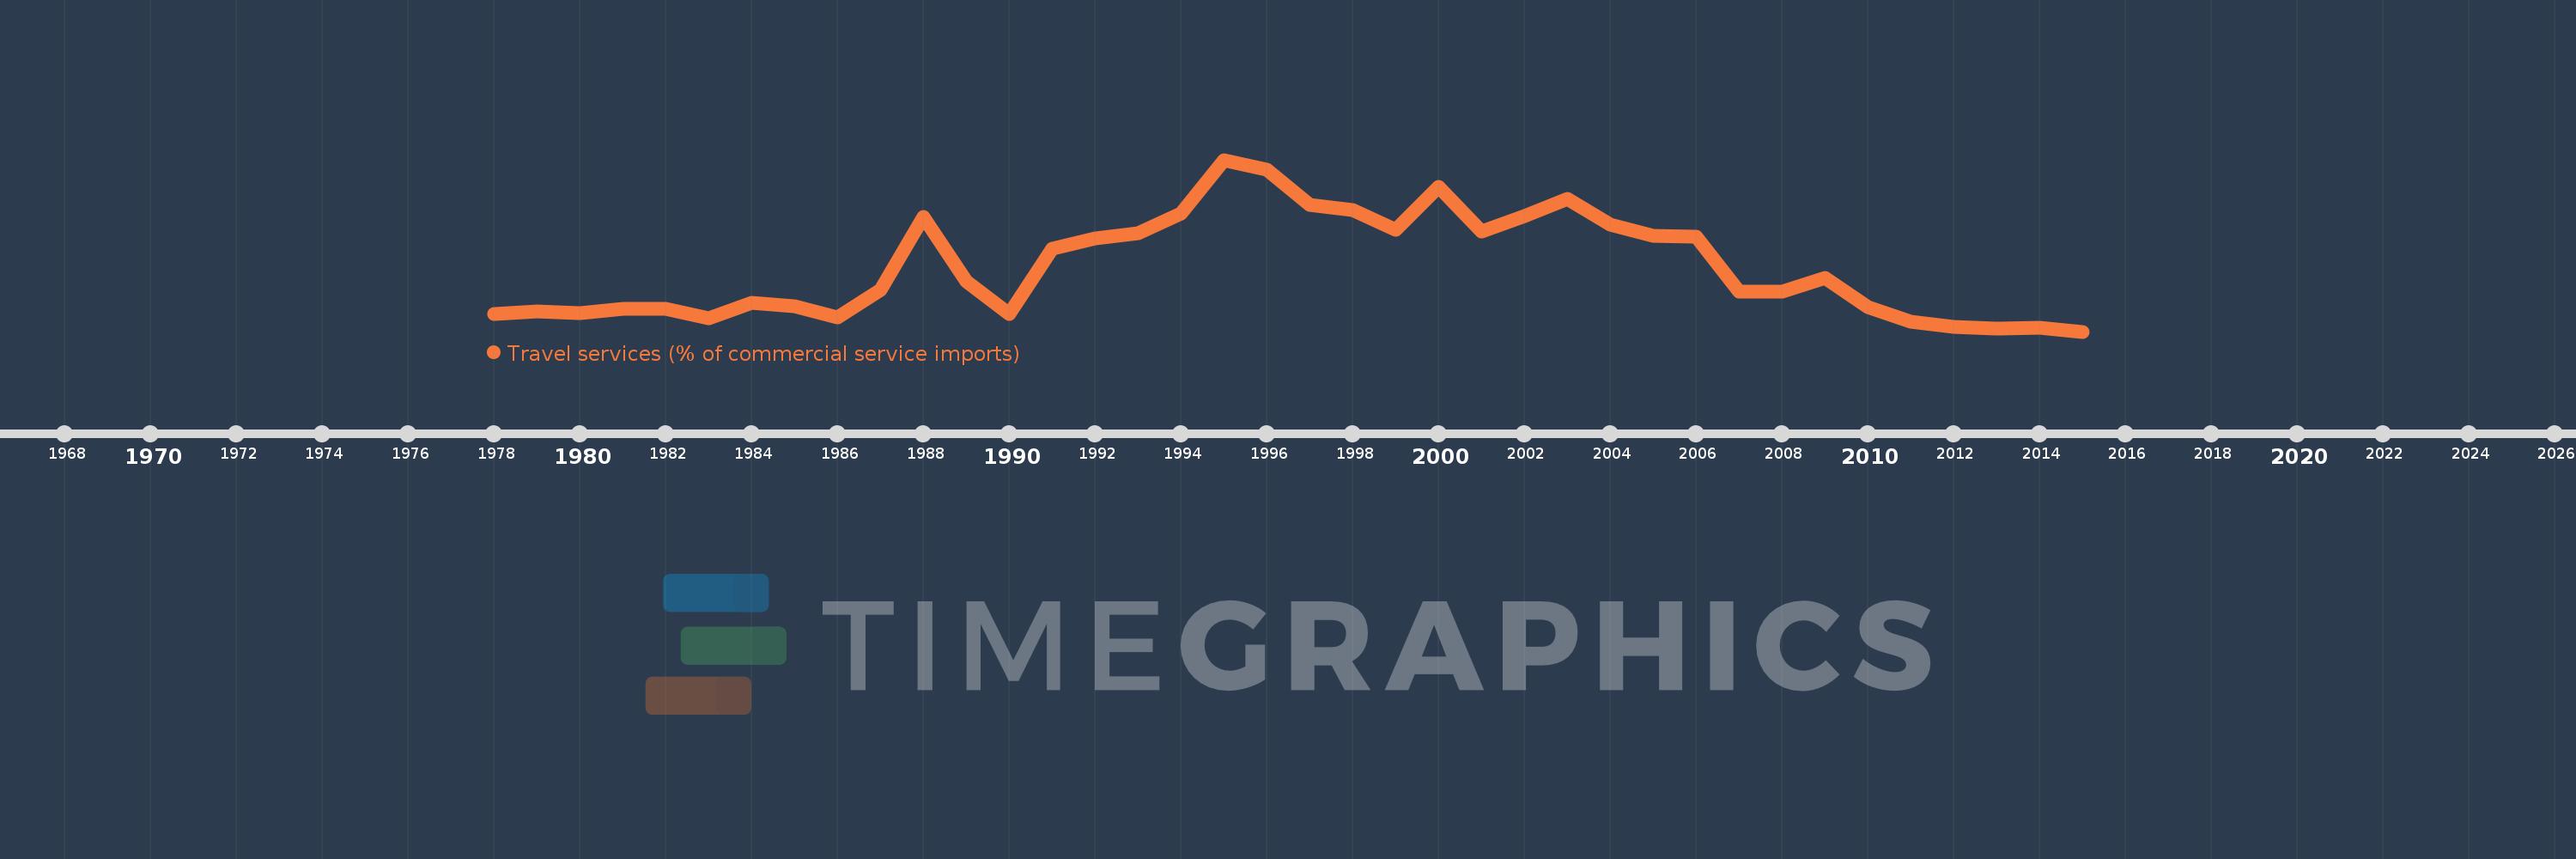
Travel services (% of commercial service imports)
2015,2014,2013,2012,2011,2010,2009,2008,2007,2006,2005,2004,2003,2002,2001,2000,1999,1998,1997,1996,1995,1994,1993,1992,1991,1990,1989,1988,1987,1986,1985,1984,1983,1982,1981,1980,1979,1978
This statistics in other country:
AfghanistanAlbaniaAlgeriaAngolaAntigua and BarbudaArab WorldArgentinaArmeniaArubaAustraliaAustriaAzerbaijanBahamas, TheBahrainBangladeshBarbadosBelarusBelgiumBelizeBeninBermudaBhutanBoliviaBosnia and HerzegovinaBotswanaBrazilBrunei DarussalamBulgariaBurkina FasoBurundiCabo VerdeCambodiaCameroonCanadaCaribbean small statesCentral African RepublicCentral Europe and the BalticsChadChileChinaColombiaComorosCongo, Dem. Rep.Congo, Rep.Costa RicaCote d'IvoireCroatiaCuracaoCyprusCzech RepublicDenmarkDjiboutiDominicaDominican RepublicEarly-demographic dividendEast Asia & PacificEast Asia & Pacific (excluding high income)East Asia & Pacific (IDA & IBRD countries)EcuadorEgypt, Arab Rep.El SalvadorEritreaEstoniaEthiopiaEuro areaEurope & Central AsiaEurope & Central Asia (excluding high income)Europe & Central Asia (IDA & IBRD countries)European UnionFaroe IslandsFijiFinlandFragile and conflict affected situationsFranceFrench PolynesiaGabonGambia, TheGeorgiaGermanyGhanaGreeceGrenadaGuatemalaGuineaGuinea-BissauGuyanaHaitiHeavily indebted poor countries (HIPC)High incomeHondurasHong Kong SAR, ChinaHungaryIBRD onlyIcelandIDA & IBRD totalIDA onlyIDA totalIndiaIndonesiaIran, Islamic Rep.IraqIrelandIsraelItalyJamaicaJapanJordanKazakhstanKenyaKiribatiKorea, Rep.KosovoKuwaitKyrgyz RepublicLao PDRLate-demographic dividendLatin America & Caribbean Latin America & Caribbean (excluding high income)Latin America & the Caribbean (IDA & IBRD countries)LatviaLeast developed countries: UN classificationLebanonLesothoLiberiaLibyaLithuaniaLow & middle incomeLow incomeLower middle incomeLuxembourgMacao SAR, ChinaMacedonia, FYRMadagascarMalawiMalaysiaMaldivesMaliMaltaMarshall IslandsMauritaniaMauritiusMexicoMicronesia, Fed. Sts.Middle East & North AfricaMiddle East & North Africa (excluding high income)Middle East & North Africa (IDA & IBRD countries)Middle incomeMoldovaMongoliaMontenegroMoroccoMozambiqueMyanmarNamibiaNepalNetherlandsNew CaledoniaNew ZealandNicaraguaNigerNigeriaNorth AmericaNorwayOECD membersOmanOther small statesPacific island small statesPakistanPalauPanamaPapua New GuineaParaguayPeruPhilippinesPolandPortugalPost-demographic dividendPre-demographic dividendQatarRomaniaRussian FederationRwandaSamoaSao Tome and PrincipeSaudi ArabiaSenegalSerbiaSeychellesSierra LeoneSingaporeSint Maarten (Dutch part)Slovak RepublicSloveniaSmall statesSolomon IslandsSouth AfricaSouth AsiaSouth Asia (IDA & IBRD)South SudanSpainSri LankaSt. Kitts and NevisSt. LuciaSt. Vincent and the GrenadinesSub-Saharan Africa Sub-Saharan Africa (excluding high income)Sub-Saharan Africa (IDA & IBRD countries)SudanSurinameSwazilandSwedenSwitzerlandSyrian Arab RepublicTajikistanTanzaniaThailandTimor-LesteTogoTongaTrinidad and TobagoTunisiaTurkeyTuvaluUgandaUkraineUnited KingdomUnited StatesUpper middle incomeUruguayVanuatuVenezuela, RBWest Bank and GazaWorldYemen, Rep.ZambiaZimbabwe Timeline:
This timeline shows a graph from 1978 to 2015 of Sierra Leone. No data until 1977. Number of actual observations by date: 38.
Source name:
World Development Indicators
Source organization:
International Monetary Fund, Balance of Payments Statistics Yearbook and data files.
Categories, topics:
Private Sector, Trade
Last updated:
apr 23, 2017
Indicators value changes by year
Maximum:
66.203
jan 1, 1995
At the date of observation
Value
Absolute change
Change from previous value
jan 1, 1978
8.255
+8.255
0.0%
jan 1, 1979
9.208
+0.953
11.54%
jan 1, 1980
8.456
-0.752
-8.16%
jan 1, 1981
10.127
+1.67
19.75%
jan 1, 1982
10.045
-0.082
-0.81%
jan 1, 1983
6.489
-3.556
-35.41%
jan 1, 1984
12.417
+5.929
91.37%
jan 1, 1985
11.072
-1.345
-10.83%
jan 1, 1986
6.773
-4.299
-38.83%
jan 1, 1987
17.281
+10.508
155.15%
jan 1, 1988
44.731
+27.45
158.84%
jan 1, 1989
20.564
-24.167
-54.03%
jan 1, 1990
8.108
-12.456
-60.57%
jan 1, 1991
32.739
+24.632
303.81%
jan 1, 1992
36.518
+3.778
11.54%
jan 1, 1993
38.594
+2.076
5.69%
jan 1, 1994
46.055
+7.461
19.33%
jan 1, 1995
66.203
+20.148
43.75%
jan 1, 1996
62.506
-3.696
-5.58%
jan 1, 1997
49.116
-13.39
-21.42%
jan 1, 1998
47.185
-1.931
-3.93%
jan 1, 1999
40.017
-7.168
-15.19%
jan 1, 2000
55.952
+15.935
39.82%
jan 1, 2001
39.24
-16.713
-29.87%
jan 1, 2002
45.177
+5.937
15.13%
jan 1, 2003
51.457
+6.281
13.9%
jan 1, 2004
41.902
-9.555
-18.57%
jan 1, 2005
37.546
-4.356
-10.4%
jan 1, 2006
37.438
-0.108
-0.29%
jan 1, 2007
16.459
-20.979
-56.04%
jan 1, 2008
16.456
-0.003
-0.02%
jan 1, 2009
21.654
+5.198
31.59%
jan 1, 2010
10.697
-10.957
-50.6%
jan 1, 2011
5.415
-5.282
-49.38%
jan 1, 2012
3.348
-2.067
-38.17%
jan 1, 2013
2.876
-0.472
-14.09%
jan 1, 2014
2.986
+0.11
3.81%
jan 1, 2015
1.596
-1.389
-46.53%
Ranking of countries by current statistics by years


Comments: