29
/
en
AIzaSyAYiBZKx7MnpbEhh9jyipgxe19OcubqV5w
April 1, 2024
145208
Guatemala
GTM
true
2
1
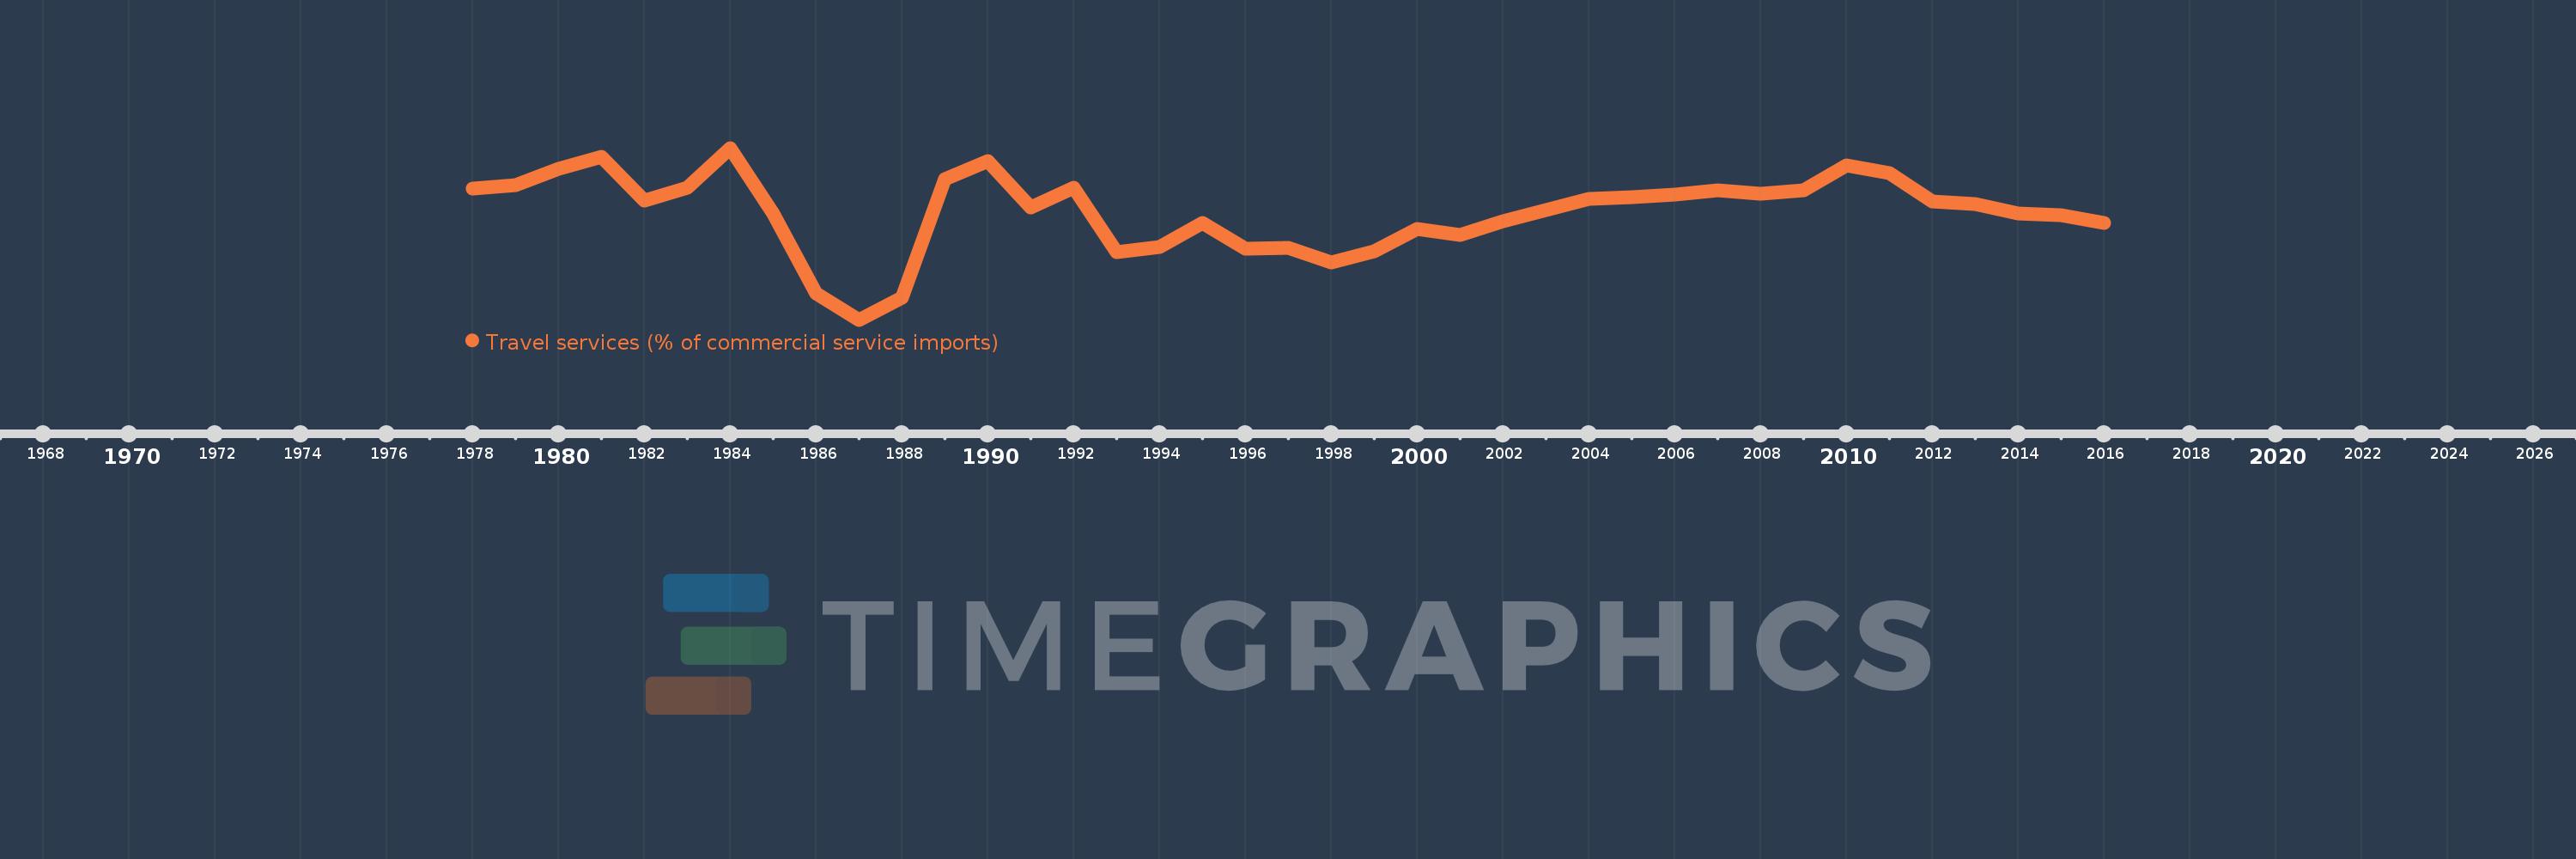
Travel services (% of commercial service imports)
2016,2015,2014,2013,2012,2011,2010,2009,2008,2007,2006,2005,2004,2003,2002,2001,2000,1999,1998,1997,1996,1995,1994,1993,1992,1991,1990,1989,1988,1987,1986,1985,1984,1983,1982,1981,1980,1979,1978
This statistics in other country:
AfghanistanAlbaniaAlgeriaAngolaAntigua and BarbudaArab WorldArgentinaArmeniaArubaAustraliaAustriaAzerbaijanBahamas, TheBahrainBangladeshBarbadosBelarusBelgiumBelizeBeninBermudaBhutanBoliviaBosnia and HerzegovinaBotswanaBrazilBrunei DarussalamBulgariaBurkina FasoBurundiCabo VerdeCambodiaCameroonCanadaCaribbean small statesCentral African RepublicCentral Europe and the BalticsChadChileChinaColombiaComorosCongo, Dem. Rep.Congo, Rep.Costa RicaCote d'IvoireCroatiaCuracaoCyprusCzech RepublicDenmarkDjiboutiDominicaDominican RepublicEarly-demographic dividendEast Asia & PacificEast Asia & Pacific (excluding high income)East Asia & Pacific (IDA & IBRD countries)EcuadorEgypt, Arab Rep.El SalvadorEritreaEstoniaEthiopiaEuro areaEurope & Central AsiaEurope & Central Asia (excluding high income)Europe & Central Asia (IDA & IBRD countries)European UnionFaroe IslandsFijiFinlandFragile and conflict affected situationsFranceFrench PolynesiaGabonGambia, TheGeorgiaGermanyGhanaGreeceGrenadaGuatemalaGuineaGuinea-BissauGuyanaHaitiHeavily indebted poor countries (HIPC)High incomeHondurasHong Kong SAR, ChinaHungaryIBRD onlyIcelandIDA & IBRD totalIDA onlyIDA totalIndiaIndonesiaIran, Islamic Rep.IraqIrelandIsraelItalyJamaicaJapanJordanKazakhstanKenyaKiribatiKorea, Rep.KosovoKuwaitKyrgyz RepublicLao PDRLate-demographic dividendLatin America & Caribbean Latin America & Caribbean (excluding high income)Latin America & the Caribbean (IDA & IBRD countries)LatviaLeast developed countries: UN classificationLebanonLesothoLiberiaLibyaLithuaniaLow & middle incomeLow incomeLower middle incomeLuxembourgMacao SAR, ChinaMacedonia, FYRMadagascarMalawiMalaysiaMaldivesMaliMaltaMarshall IslandsMauritaniaMauritiusMexicoMicronesia, Fed. Sts.Middle East & North AfricaMiddle East & North Africa (excluding high income)Middle East & North Africa (IDA & IBRD countries)Middle incomeMoldovaMongoliaMontenegroMoroccoMozambiqueMyanmarNamibiaNepalNetherlandsNew CaledoniaNew ZealandNicaraguaNigerNigeriaNorth AmericaNorwayOECD membersOmanOther small statesPacific island small statesPakistanPalauPanamaPapua New GuineaParaguayPeruPhilippinesPolandPortugalPost-demographic dividendPre-demographic dividendQatarRomaniaRussian FederationRwandaSamoaSao Tome and PrincipeSaudi ArabiaSenegalSerbiaSeychellesSierra LeoneSingaporeSint Maarten (Dutch part)Slovak RepublicSloveniaSmall statesSolomon IslandsSouth AfricaSouth AsiaSouth Asia (IDA & IBRD)South SudanSpainSri LankaSt. Kitts and NevisSt. LuciaSt. Vincent and the GrenadinesSub-Saharan Africa Sub-Saharan Africa (excluding high income)Sub-Saharan Africa (IDA & IBRD countries)SudanSurinameSwazilandSwedenSwitzerlandSyrian Arab RepublicTajikistanTanzaniaThailandTimor-LesteTogoTongaTrinidad and TobagoTunisiaTurkeyTuvaluUgandaUkraineUnited KingdomUnited StatesUpper middle incomeUruguayVanuatuVenezuela, RBWest Bank and GazaWorldYemen, Rep.ZambiaZimbabwe Timeline:
This timeline shows a graph from 1978 to 2016 of Guatemala. No data until 1977. Number of actual observations by date: 39.
Source name:
World Development Indicators
Source organization:
International Monetary Fund, Balance of Payments Statistics Yearbook and data files.
Categories, topics:
Private Sector, Trade
Last updated:
apr 23, 2017
Indicators value changes by year
At the date of observation
Value
Absolute change
Change from previous value
jan 1, 1978
30.341
+30.341
0.0%
jan 1, 1979
30.957
+0.616
2.03%
jan 1, 1980
33.519
+2.562
8.28%
jan 1, 1981
35.368
+1.848
5.51%
jan 1, 1982
28.544
-6.824
-19.29%
jan 1, 1983
30.468
+1.924
6.74%
jan 1, 1984
36.7
+6.232
20.45%
jan 1, 1985
26.463
-10.237
-27.89%
jan 1, 1986
14.072
-12.391
-46.82%
jan 1, 1987
9.993
-4.078
-28.98%
jan 1, 1988
13.377
+3.383
33.86%
jan 1, 1989
31.839
+18.463
138.02%
jan 1, 1990
34.701
+2.861
8.99%
jan 1, 1991
27.423
-7.278
-20.97%
jan 1, 1992
30.549
+3.126
11.4%
jan 1, 1993
20.568
-9.981
-32.67%
jan 1, 1994
21.365
+0.797
3.88%
jan 1, 1995
25.046
+3.681
17.23%
jan 1, 1996
20.996
-4.049
-16.17%
jan 1, 1997
21.232
+0.235
1.12%
jan 1, 1998
18.944
-2.288
-10.78%
jan 1, 1999
20.682
+1.739
9.18%
jan 1, 2000
24.115
+3.432
16.6%
jan 1, 2001
23.152
-0.962
-3.99%
jan 1, 2002
25.353
+2.2
9.5%
jan 1, 2003
27.064
+1.711
6.75%
jan 1, 2004
28.746
+1.682
6.21%
jan 1, 2005
29.093
+0.348
1.21%
jan 1, 2006
29.451
+0.358
1.23%
jan 1, 2007
30.09
+0.639
2.17%
jan 1, 2008
29.608
-0.482
-1.6%
jan 1, 2009
30.148
+0.539
1.82%
jan 1, 2010
33.939
+3.791
12.58%
jan 1, 2011
32.838
-1.101
-3.24%
jan 1, 2012
28.337
-4.501
-13.71%
jan 1, 2013
27.97
-0.366
-1.29%
jan 1, 2014
26.449
-1.521
-5.44%
jan 1, 2015
26.211
-0.238
-0.9%
jan 1, 2016
25.037
-1.174
-4.48%
Ranking of countries by current statistics by years


Comments: