29
/
en
AIzaSyAYiBZKx7MnpbEhh9jyipgxe19OcubqV5w
April 1, 2024
191040
Mali
MLI
true
2
1
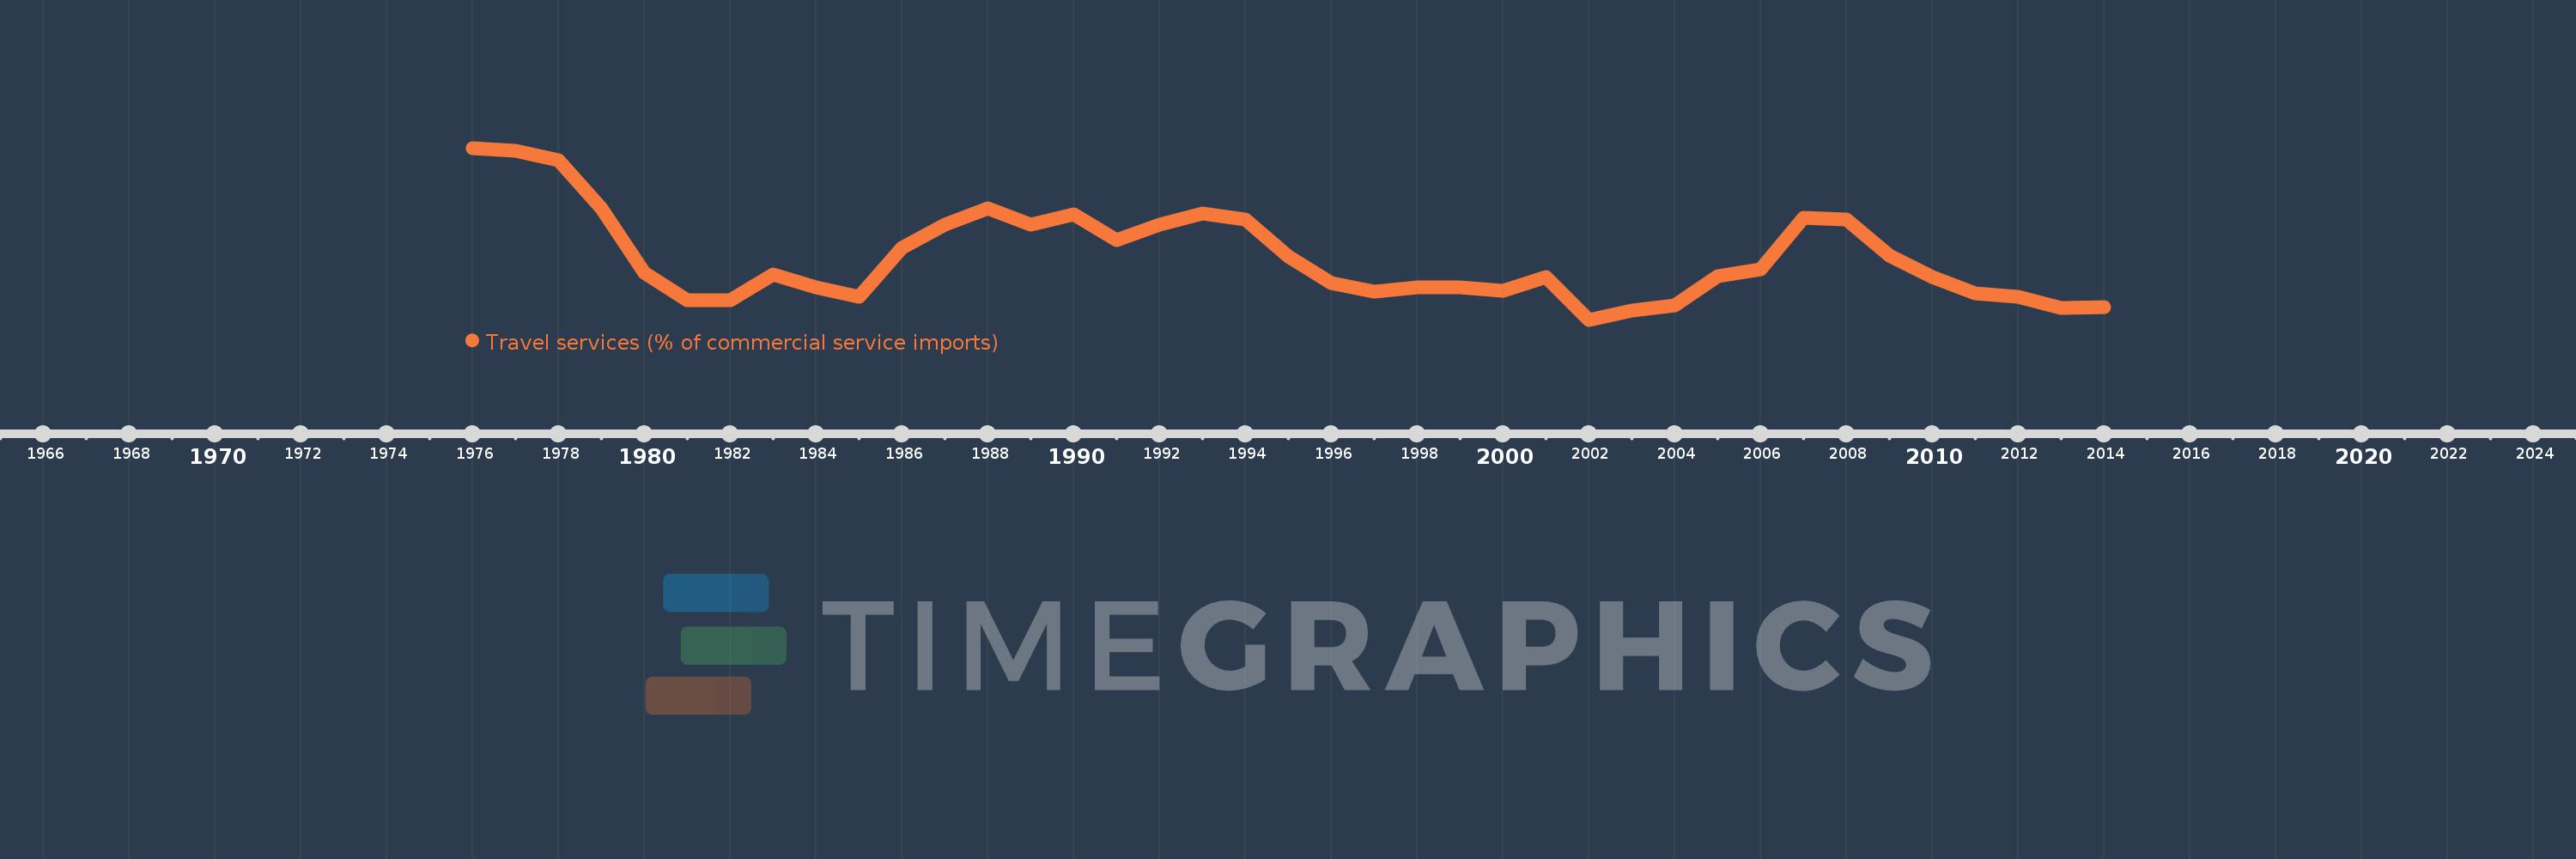
Travel services (% of commercial service imports)
2014,2013,2012,2011,2010,2009,2008,2007,2006,2005,2004,2003,2002,2001,2000,1999,1998,1997,1996,1995,1994,1993,1992,1991,1990,1989,1988,1987,1986,1985,1984,1983,1982,1981,1980,1979,1978,1977,1976
This statistics in other country:
AfghanistanAlbaniaAlgeriaAngolaAntigua and BarbudaArab WorldArgentinaArmeniaArubaAustraliaAustriaAzerbaijanBahamas, TheBahrainBangladeshBarbadosBelarusBelgiumBelizeBeninBermudaBhutanBoliviaBosnia and HerzegovinaBotswanaBrazilBrunei DarussalamBulgariaBurkina FasoBurundiCabo VerdeCambodiaCameroonCanadaCaribbean small statesCentral African RepublicCentral Europe and the BalticsChadChileChinaColombiaComorosCongo, Dem. Rep.Congo, Rep.Costa RicaCote d'IvoireCroatiaCuracaoCyprusCzech RepublicDenmarkDjiboutiDominicaDominican RepublicEarly-demographic dividendEast Asia & PacificEast Asia & Pacific (excluding high income)East Asia & Pacific (IDA & IBRD countries)EcuadorEgypt, Arab Rep.El SalvadorEritreaEstoniaEthiopiaEuro areaEurope & Central AsiaEurope & Central Asia (excluding high income)Europe & Central Asia (IDA & IBRD countries)European UnionFaroe IslandsFijiFinlandFragile and conflict affected situationsFranceFrench PolynesiaGabonGambia, TheGeorgiaGermanyGhanaGreeceGrenadaGuatemalaGuineaGuinea-BissauGuyanaHaitiHeavily indebted poor countries (HIPC)High incomeHondurasHong Kong SAR, ChinaHungaryIBRD onlyIcelandIDA & IBRD totalIDA onlyIDA totalIndiaIndonesiaIran, Islamic Rep.IraqIrelandIsraelItalyJamaicaJapanJordanKazakhstanKenyaKiribatiKorea, Rep.KosovoKuwaitKyrgyz RepublicLao PDRLate-demographic dividendLatin America & Caribbean Latin America & Caribbean (excluding high income)Latin America & the Caribbean (IDA & IBRD countries)LatviaLeast developed countries: UN classificationLebanonLesothoLiberiaLibyaLithuaniaLow & middle incomeLow incomeLower middle incomeLuxembourgMacao SAR, ChinaMacedonia, FYRMadagascarMalawiMalaysiaMaldivesMaliMaltaMarshall IslandsMauritaniaMauritiusMexicoMicronesia, Fed. Sts.Middle East & North AfricaMiddle East & North Africa (excluding high income)Middle East & North Africa (IDA & IBRD countries)Middle incomeMoldovaMongoliaMontenegroMoroccoMozambiqueMyanmarNamibiaNepalNetherlandsNew CaledoniaNew ZealandNicaraguaNigerNigeriaNorth AmericaNorwayOECD membersOmanOther small statesPacific island small statesPakistanPalauPanamaPapua New GuineaParaguayPeruPhilippinesPolandPortugalPost-demographic dividendPre-demographic dividendQatarRomaniaRussian FederationRwandaSamoaSao Tome and PrincipeSaudi ArabiaSenegalSerbiaSeychellesSierra LeoneSingaporeSint Maarten (Dutch part)Slovak RepublicSloveniaSmall statesSolomon IslandsSouth AfricaSouth AsiaSouth Asia (IDA & IBRD)South SudanSpainSri LankaSt. Kitts and NevisSt. LuciaSt. Vincent and the GrenadinesSub-Saharan Africa Sub-Saharan Africa (excluding high income)Sub-Saharan Africa (IDA & IBRD countries)SudanSurinameSwazilandSwedenSwitzerlandSyrian Arab RepublicTajikistanTanzaniaThailandTimor-LesteTogoTongaTrinidad and TobagoTunisiaTurkeyTuvaluUgandaUkraineUnited KingdomUnited StatesUpper middle incomeUruguayVanuatuVenezuela, RBWest Bank and GazaWorldYemen, Rep.ZambiaZimbabwe Timeline:
This timeline shows a graph from 1976 to 2014 of Mali. No data until 1975. Number of actual observations by date: 39.
Source name:
World Development Indicators
Source organization:
International Monetary Fund, Balance of Payments Statistics Yearbook and data files.
Categories, topics:
Private Sector, Trade
Last updated:
apr 23, 2017
Indicators value changes by year
Maximum:
24.127
jan 1, 1976
At the date of observation
Value
Absolute change
Change from previous value
jan 1, 1976
24.127
+24.127
0.0%
jan 1, 1977
23.901
-0.226
-0.93%
jan 1, 1978
23.041
-0.86
-3.6%
jan 1, 1979
18.681
-4.36
-18.92%
jan 1, 1980
12.833
-5.848
-31.3%
jan 1, 1981
10.374
-2.459
-19.16%
jan 1, 1982
10.373
-0.001
-0.01%
jan 1, 1983
12.714
+2.341
22.57%
jan 1, 1984
11.519
-1.196
-9.4%
jan 1, 1985
10.704
-0.815
-7.08%
jan 1, 1986
15.106
+4.403
41.13%
jan 1, 1987
17.205
+2.099
13.89%
jan 1, 1988
18.702
+1.497
8.7%
jan 1, 1989
17.202
-1.5
-8.02%
jan 1, 1990
18.097
+0.894
5.2%
jan 1, 1991
15.765
-2.332
-12.89%
jan 1, 1992
17.224
+1.46
9.26%
jan 1, 1993
18.198
+0.974
5.66%
jan 1, 1994
17.653
-0.545
-3.0%
jan 1, 1995
14.292
-3.362
-19.04%
jan 1, 1996
11.932
-2.36
-16.51%
jan 1, 1997
11.165
-0.767
-6.42%
jan 1, 1998
11.557
+0.391
3.51%
jan 1, 1999
11.551
-0.006
-0.05%
jan 1, 2000
11.218
-0.333
-2.88%
jan 1, 2001
12.437
+1.219
10.87%
jan 1, 2002
8.595
-3.842
-30.89%
jan 1, 2003
9.405
+0.81
9.42%
jan 1, 2004
9.89
+0.485
5.16%
jan 1, 2005
12.537
+2.647
26.77%
jan 1, 2006
13.154
+0.616
4.92%
jan 1, 2007
17.836
+4.682
35.6%
jan 1, 2008
17.684
-0.152
-0.85%
jan 1, 2009
14.369
-3.315
-18.75%
jan 1, 2010
12.432
-1.937
-13.48%
jan 1, 2011
11.004
-1.427
-11.48%
jan 1, 2012
10.686
-0.318
-2.89%
jan 1, 2013
9.635
-1.052
-9.84%
jan 1, 2014
9.698
+0.063
0.66%
Ranking of countries by current statistics by years


Comments: