29
/
en
AIzaSyAYiBZKx7MnpbEhh9jyipgxe19OcubqV5w
April 1, 2024
268819
Tunisia
TUN
true
2
1
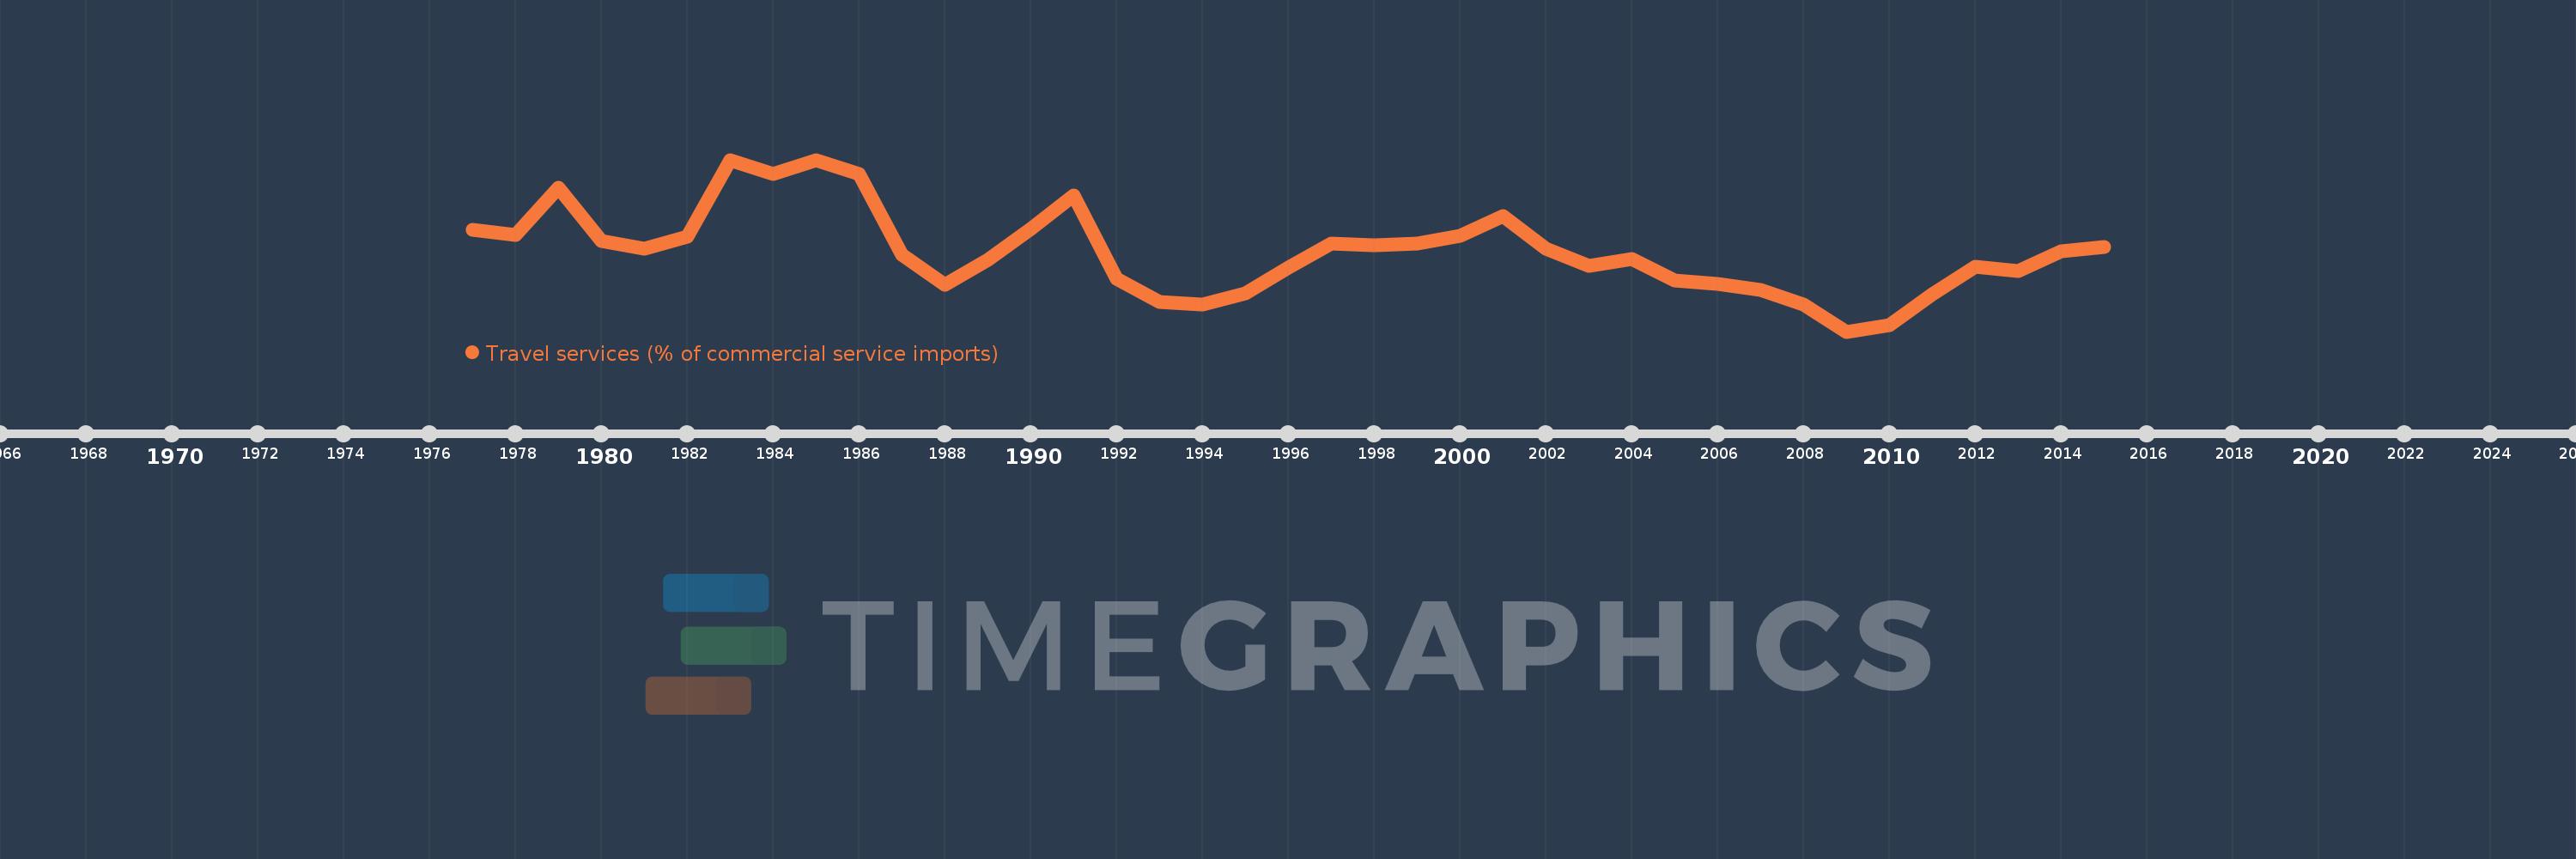
Travel services (% of commercial service imports)
2015,2014,2013,2012,2011,2010,2009,2008,2007,2006,2005,2004,2003,2002,2001,2000,1999,1998,1997,1996,1995,1994,1993,1992,1991,1990,1989,1988,1987,1986,1985,1984,1983,1982,1981,1980,1979,1978,1977
This statistics in other country:
AfghanistanAlbaniaAlgeriaAngolaAntigua and BarbudaArab WorldArgentinaArmeniaArubaAustraliaAustriaAzerbaijanBahamas, TheBahrainBangladeshBarbadosBelarusBelgiumBelizeBeninBermudaBhutanBoliviaBosnia and HerzegovinaBotswanaBrazilBrunei DarussalamBulgariaBurkina FasoBurundiCabo VerdeCambodiaCameroonCanadaCaribbean small statesCentral African RepublicCentral Europe and the BalticsChadChileChinaColombiaComorosCongo, Dem. Rep.Congo, Rep.Costa RicaCote d'IvoireCroatiaCuracaoCyprusCzech RepublicDenmarkDjiboutiDominicaDominican RepublicEarly-demographic dividendEast Asia & PacificEast Asia & Pacific (excluding high income)East Asia & Pacific (IDA & IBRD countries)EcuadorEgypt, Arab Rep.El SalvadorEritreaEstoniaEthiopiaEuro areaEurope & Central AsiaEurope & Central Asia (excluding high income)Europe & Central Asia (IDA & IBRD countries)European UnionFaroe IslandsFijiFinlandFragile and conflict affected situationsFranceFrench PolynesiaGabonGambia, TheGeorgiaGermanyGhanaGreeceGrenadaGuatemalaGuineaGuinea-BissauGuyanaHaitiHeavily indebted poor countries (HIPC)High incomeHondurasHong Kong SAR, ChinaHungaryIBRD onlyIcelandIDA & IBRD totalIDA onlyIDA totalIndiaIndonesiaIran, Islamic Rep.IraqIrelandIsraelItalyJamaicaJapanJordanKazakhstanKenyaKiribatiKorea, Rep.KosovoKuwaitKyrgyz RepublicLao PDRLate-demographic dividendLatin America & Caribbean Latin America & Caribbean (excluding high income)Latin America & the Caribbean (IDA & IBRD countries)LatviaLeast developed countries: UN classificationLebanonLesothoLiberiaLibyaLithuaniaLow & middle incomeLow incomeLower middle incomeLuxembourgMacao SAR, ChinaMacedonia, FYRMadagascarMalawiMalaysiaMaldivesMaliMaltaMarshall IslandsMauritaniaMauritiusMexicoMicronesia, Fed. Sts.Middle East & North AfricaMiddle East & North Africa (excluding high income)Middle East & North Africa (IDA & IBRD countries)Middle incomeMoldovaMongoliaMontenegroMoroccoMozambiqueMyanmarNamibiaNepalNetherlandsNew CaledoniaNew ZealandNicaraguaNigerNigeriaNorth AmericaNorwayOECD membersOmanOther small statesPacific island small statesPakistanPalauPanamaPapua New GuineaParaguayPeruPhilippinesPolandPortugalPost-demographic dividendPre-demographic dividendQatarRomaniaRussian FederationRwandaSamoaSao Tome and PrincipeSaudi ArabiaSenegalSerbiaSeychellesSierra LeoneSingaporeSint Maarten (Dutch part)Slovak RepublicSloveniaSmall statesSolomon IslandsSouth AfricaSouth AsiaSouth Asia (IDA & IBRD)South SudanSpainSri LankaSt. Kitts and NevisSt. LuciaSt. Vincent and the GrenadinesSub-Saharan Africa Sub-Saharan Africa (excluding high income)Sub-Saharan Africa (IDA & IBRD countries)SudanSurinameSwazilandSwedenSwitzerlandSyrian Arab RepublicTajikistanTanzaniaThailandTimor-LesteTogoTongaTrinidad and TobagoTunisiaTurkeyTuvaluUgandaUkraineUnited KingdomUnited StatesUpper middle incomeUruguayVanuatuVenezuela, RBWest Bank and GazaWorldYemen, Rep.ZambiaZimbabwe Timeline:
This timeline shows a graph from 1977 to 2015 of Tunisia. No data until 1976. Number of actual observations by date: 39.
Source name:
World Development Indicators
Source organization:
International Monetary Fund, Balance of Payments Statistics Yearbook and data files.
Categories, topics:
Private Sector, Trade
Last updated:
apr 23, 2017
Indicators value changes by year
Minimum:
14.741
jan 1, 2009
Maximum:
29.255
jan 1, 1985
At the date of observation
Value
Absolute change
Change from previous value
jan 1, 1977
23.364
+23.364
0.0%
jan 1, 1978
22.881
-0.483
-2.07%
jan 1, 1979
26.866
+3.984
17.41%
jan 1, 1980
22.424
-4.441
-16.53%
jan 1, 1981
21.717
-0.707
-3.15%
jan 1, 1982
22.785
+1.068
4.92%
jan 1, 1983
29.195
+6.41
28.13%
jan 1, 1984
28.049
-1.146
-3.92%
jan 1, 1985
29.255
+1.207
4.3%
jan 1, 1986
28.075
-1.18
-4.04%
jan 1, 1987
21.25
-6.825
-24.31%
jan 1, 1988
18.66
-2.59
-12.19%
jan 1, 1989
20.808
+2.148
11.51%
jan 1, 1990
23.432
+2.624
12.61%
jan 1, 1991
26.21
+2.779
11.86%
jan 1, 1992
19.218
-6.992
-26.68%
jan 1, 1993
17.249
-1.969
-10.24%
jan 1, 1994
17.014
-0.235
-1.36%
jan 1, 1995
17.987
+0.973
5.72%
jan 1, 1996
20.136
+2.149
11.95%
jan 1, 1997
22.162
+2.026
10.06%
jan 1, 1998
22.053
-0.109
-0.49%
jan 1, 1999
22.149
+0.096
0.44%
jan 1, 2000
22.83
+0.681
3.07%
jan 1, 2001
24.523
+1.694
7.42%
jan 1, 2002
21.737
-2.786
-11.36%
jan 1, 2003
20.319
-1.418
-6.52%
jan 1, 2004
20.908
+0.589
2.9%
jan 1, 2005
19.045
-1.862
-8.91%
jan 1, 2006
18.784
-0.262
-1.37%
jan 1, 2007
18.26
-0.524
-2.79%
jan 1, 2008
17.011
-1.249
-6.84%
jan 1, 2009
14.741
-2.27
-13.35%
jan 1, 2010
15.315
+0.574
3.9%
jan 1, 2011
17.916
+2.601
16.98%
jan 1, 2012
20.206
+2.29
12.78%
jan 1, 2013
19.844
-0.362
-1.79%
jan 1, 2014
21.511
+1.668
8.4%
jan 1, 2015
21.877
+0.366
1.7%
Ranking of countries by current statistics by years


Comments: