29
/
en
AIzaSyAYiBZKx7MnpbEhh9jyipgxe19OcubqV5w
April 1, 2024
212480
Niger
NER
true
2
1
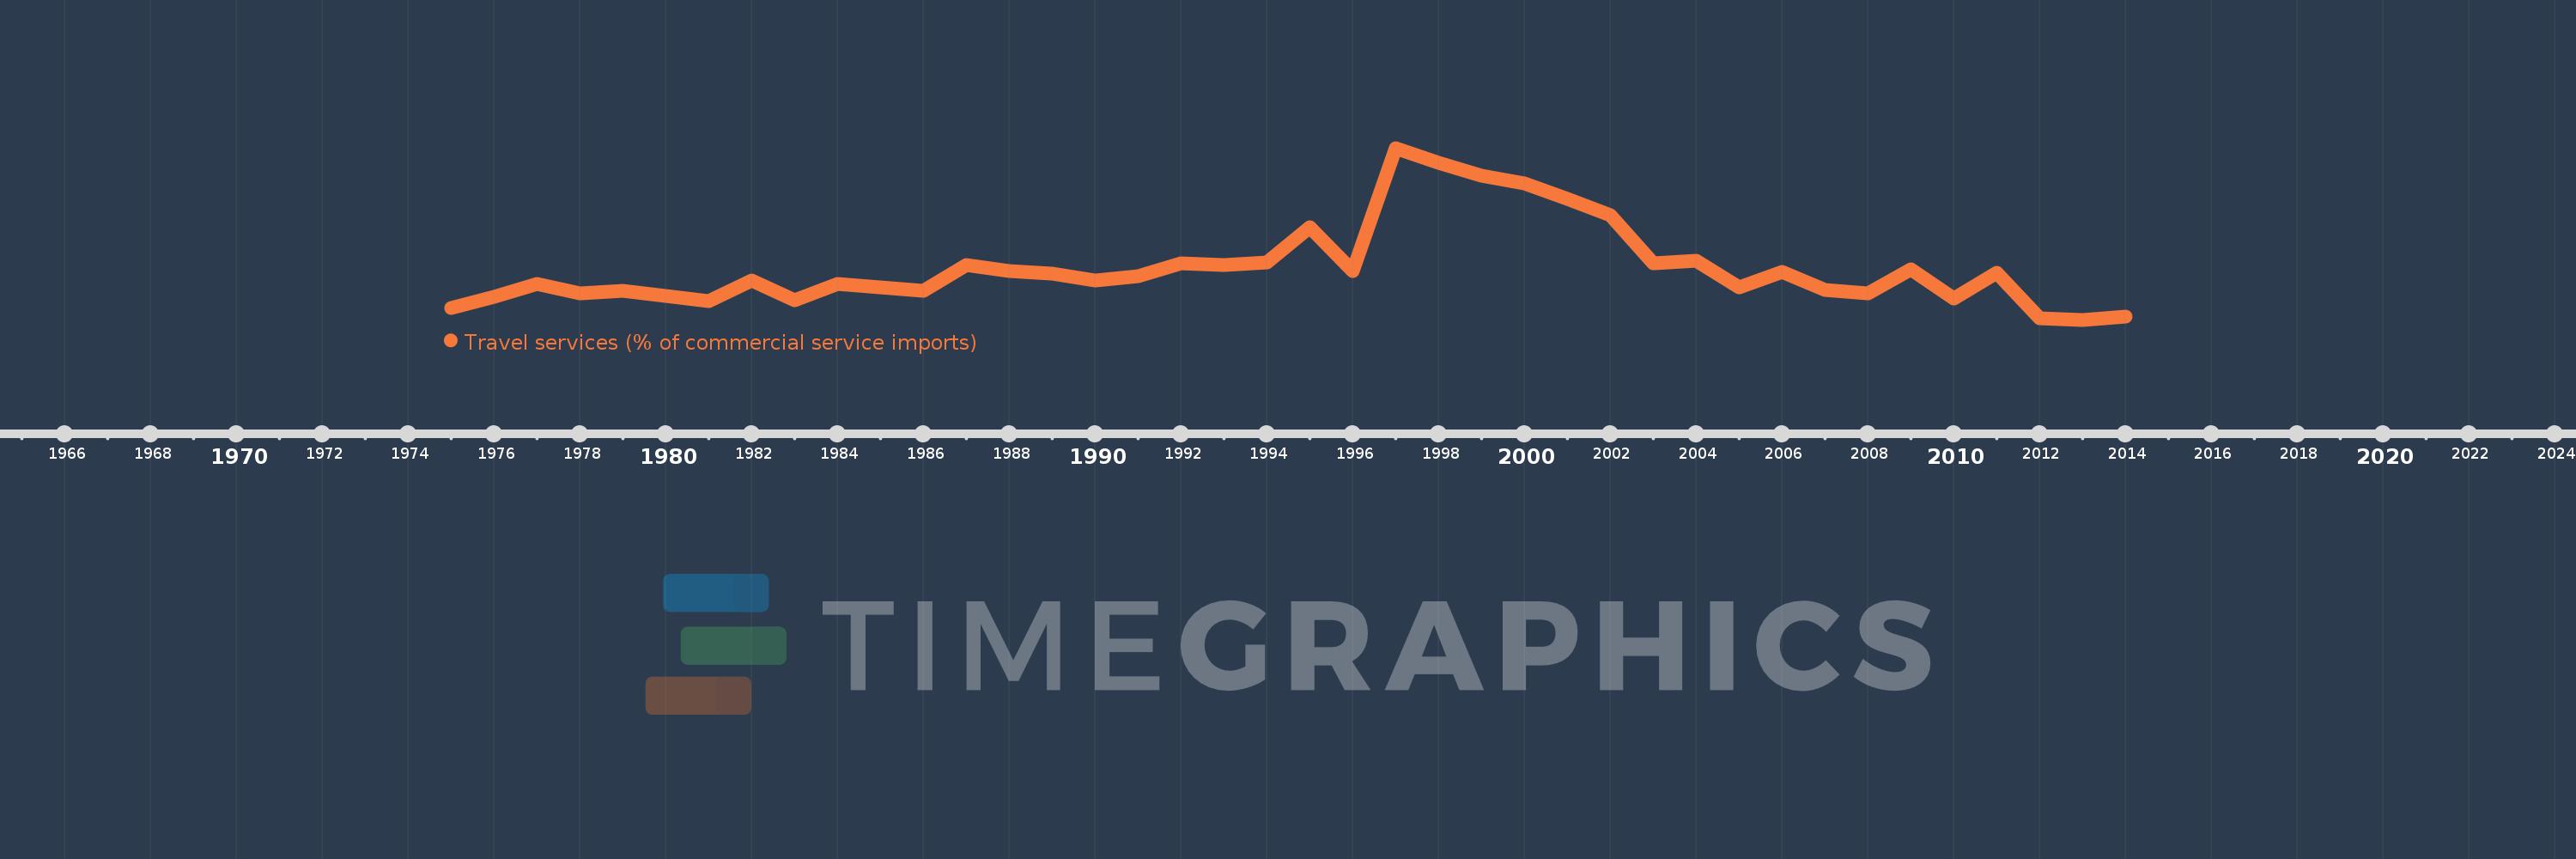
Travel services (% of commercial service imports)
2014,2013,2012,2011,2010,2009,2008,2007,2006,2005,2004,2003,2002,2001,2000,1999,1998,1997,1996,1995,1994,1993,1992,1991,1990,1989,1988,1987,1986,1985,1984,1983,1982,1981,1980,1979,1978,1977,1976,1975
This statistics in other country:
AfghanistanAlbaniaAlgeriaAngolaAntigua and BarbudaArab WorldArgentinaArmeniaArubaAustraliaAustriaAzerbaijanBahamas, TheBahrainBangladeshBarbadosBelarusBelgiumBelizeBeninBermudaBhutanBoliviaBosnia and HerzegovinaBotswanaBrazilBrunei DarussalamBulgariaBurkina FasoBurundiCabo VerdeCambodiaCameroonCanadaCaribbean small statesCentral African RepublicCentral Europe and the BalticsChadChileChinaColombiaComorosCongo, Dem. Rep.Congo, Rep.Costa RicaCote d'IvoireCroatiaCuracaoCyprusCzech RepublicDenmarkDjiboutiDominicaDominican RepublicEarly-demographic dividendEast Asia & PacificEast Asia & Pacific (excluding high income)East Asia & Pacific (IDA & IBRD countries)EcuadorEgypt, Arab Rep.El SalvadorEritreaEstoniaEthiopiaEuro areaEurope & Central AsiaEurope & Central Asia (excluding high income)Europe & Central Asia (IDA & IBRD countries)European UnionFaroe IslandsFijiFinlandFragile and conflict affected situationsFranceFrench PolynesiaGabonGambia, TheGeorgiaGermanyGhanaGreeceGrenadaGuatemalaGuineaGuinea-BissauGuyanaHaitiHeavily indebted poor countries (HIPC)High incomeHondurasHong Kong SAR, ChinaHungaryIBRD onlyIcelandIDA & IBRD totalIDA onlyIDA totalIndiaIndonesiaIran, Islamic Rep.IraqIrelandIsraelItalyJamaicaJapanJordanKazakhstanKenyaKiribatiKorea, Rep.KosovoKuwaitKyrgyz RepublicLao PDRLate-demographic dividendLatin America & Caribbean Latin America & Caribbean (excluding high income)Latin America & the Caribbean (IDA & IBRD countries)LatviaLeast developed countries: UN classificationLebanonLesothoLiberiaLibyaLithuaniaLow & middle incomeLow incomeLower middle incomeLuxembourgMacao SAR, ChinaMacedonia, FYRMadagascarMalawiMalaysiaMaldivesMaliMaltaMarshall IslandsMauritaniaMauritiusMexicoMicronesia, Fed. Sts.Middle East & North AfricaMiddle East & North Africa (excluding high income)Middle East & North Africa (IDA & IBRD countries)Middle incomeMoldovaMongoliaMontenegroMoroccoMozambiqueMyanmarNamibiaNepalNetherlandsNew CaledoniaNew ZealandNicaraguaNigerNigeriaNorth AmericaNorwayOECD membersOmanOther small statesPacific island small statesPakistanPalauPanamaPapua New GuineaParaguayPeruPhilippinesPolandPortugalPost-demographic dividendPre-demographic dividendQatarRomaniaRussian FederationRwandaSamoaSao Tome and PrincipeSaudi ArabiaSenegalSerbiaSeychellesSierra LeoneSingaporeSint Maarten (Dutch part)Slovak RepublicSloveniaSmall statesSolomon IslandsSouth AfricaSouth AsiaSouth Asia (IDA & IBRD)South SudanSpainSri LankaSt. Kitts and NevisSt. LuciaSt. Vincent and the GrenadinesSub-Saharan Africa Sub-Saharan Africa (excluding high income)Sub-Saharan Africa (IDA & IBRD countries)SudanSurinameSwazilandSwedenSwitzerlandSyrian Arab RepublicTajikistanTanzaniaThailandTimor-LesteTogoTongaTrinidad and TobagoTunisiaTurkeyTuvaluUgandaUkraineUnited KingdomUnited StatesUpper middle incomeUruguayVanuatuVenezuela, RBWest Bank and GazaWorldYemen, Rep.ZambiaZimbabwe Timeline:
This timeline shows a graph from 1975 to 2014 of Niger. No data until 1974. Number of actual observations by date: 40.
Source name:
World Development Indicators
Source organization:
International Monetary Fund, Balance of Payments Statistics Yearbook and data files.
Categories, topics:
Private Sector, Trade
Last updated:
apr 23, 2017
Indicators value changes by year
Maximum:
28.075
jan 1, 1997
At the date of observation
Value
Absolute change
Change from previous value
jan 1, 1975
6.019
+6.019
0.0%
jan 1, 1976
7.536
+1.517
25.2%
jan 1, 1977
9.294
+1.758
23.33%
jan 1, 1978
7.974
-1.32
-14.2%
jan 1, 1979
8.433
+0.458
5.75%
jan 1, 1980
7.638
-0.795
-9.43%
jan 1, 1981
6.926
-0.712
-9.32%
jan 1, 1982
9.745
+2.82
40.71%
jan 1, 1983
7.029
-2.716
-27.87%
jan 1, 1984
9.348
+2.319
32.98%
jan 1, 1985
8.907
-0.441
-4.72%
jan 1, 1986
8.356
-0.551
-6.19%
jan 1, 1987
11.975
+3.619
43.31%
jan 1, 1988
11.149
-0.826
-6.9%
jan 1, 1989
10.724
-0.425
-3.81%
jan 1, 1990
9.824
-0.9
-8.39%
jan 1, 1991
10.372
+0.548
5.58%
jan 1, 1992
12.14
+1.769
17.05%
jan 1, 1993
11.887
-0.254
-2.09%
jan 1, 1994
12.303
+0.416
3.5%
jan 1, 1995
17.115
+4.812
39.11%
jan 1, 1996
11.064
-6.051
-35.36%
jan 1, 1997
28.075
+17.011
153.76%
jan 1, 1998
26.063
-2.012
-7.17%
jan 1, 1999
24.216
-1.847
-7.09%
jan 1, 2000
23.239
-0.977
-4.03%
jan 1, 2001
20.999
-2.24
-9.64%
jan 1, 2002
18.819
-2.18
-10.38%
jan 1, 2003
12.174
-6.645
-35.31%
jan 1, 2004
12.562
+0.389
3.19%
jan 1, 2005
8.907
-3.656
-29.1%
jan 1, 2006
10.943
+2.036
22.86%
jan 1, 2007
8.438
-2.505
-22.89%
jan 1, 2008
7.972
-0.466
-5.52%
jan 1, 2009
11.371
+3.399
42.63%
jan 1, 2010
7.3
-4.071
-35.8%
jan 1, 2011
10.846
+3.546
48.57%
jan 1, 2012
4.557
-6.289
-57.98%
jan 1, 2013
4.384
-0.173
-3.8%
jan 1, 2014
4.785
+0.401
9.15%
Ranking of countries by current statistics by years


Comments: