29
/
en
AIzaSyAYiBZKx7MnpbEhh9jyipgxe19OcubqV5w
April 1, 2024
208544
Netherlands
NLD
true
2
1
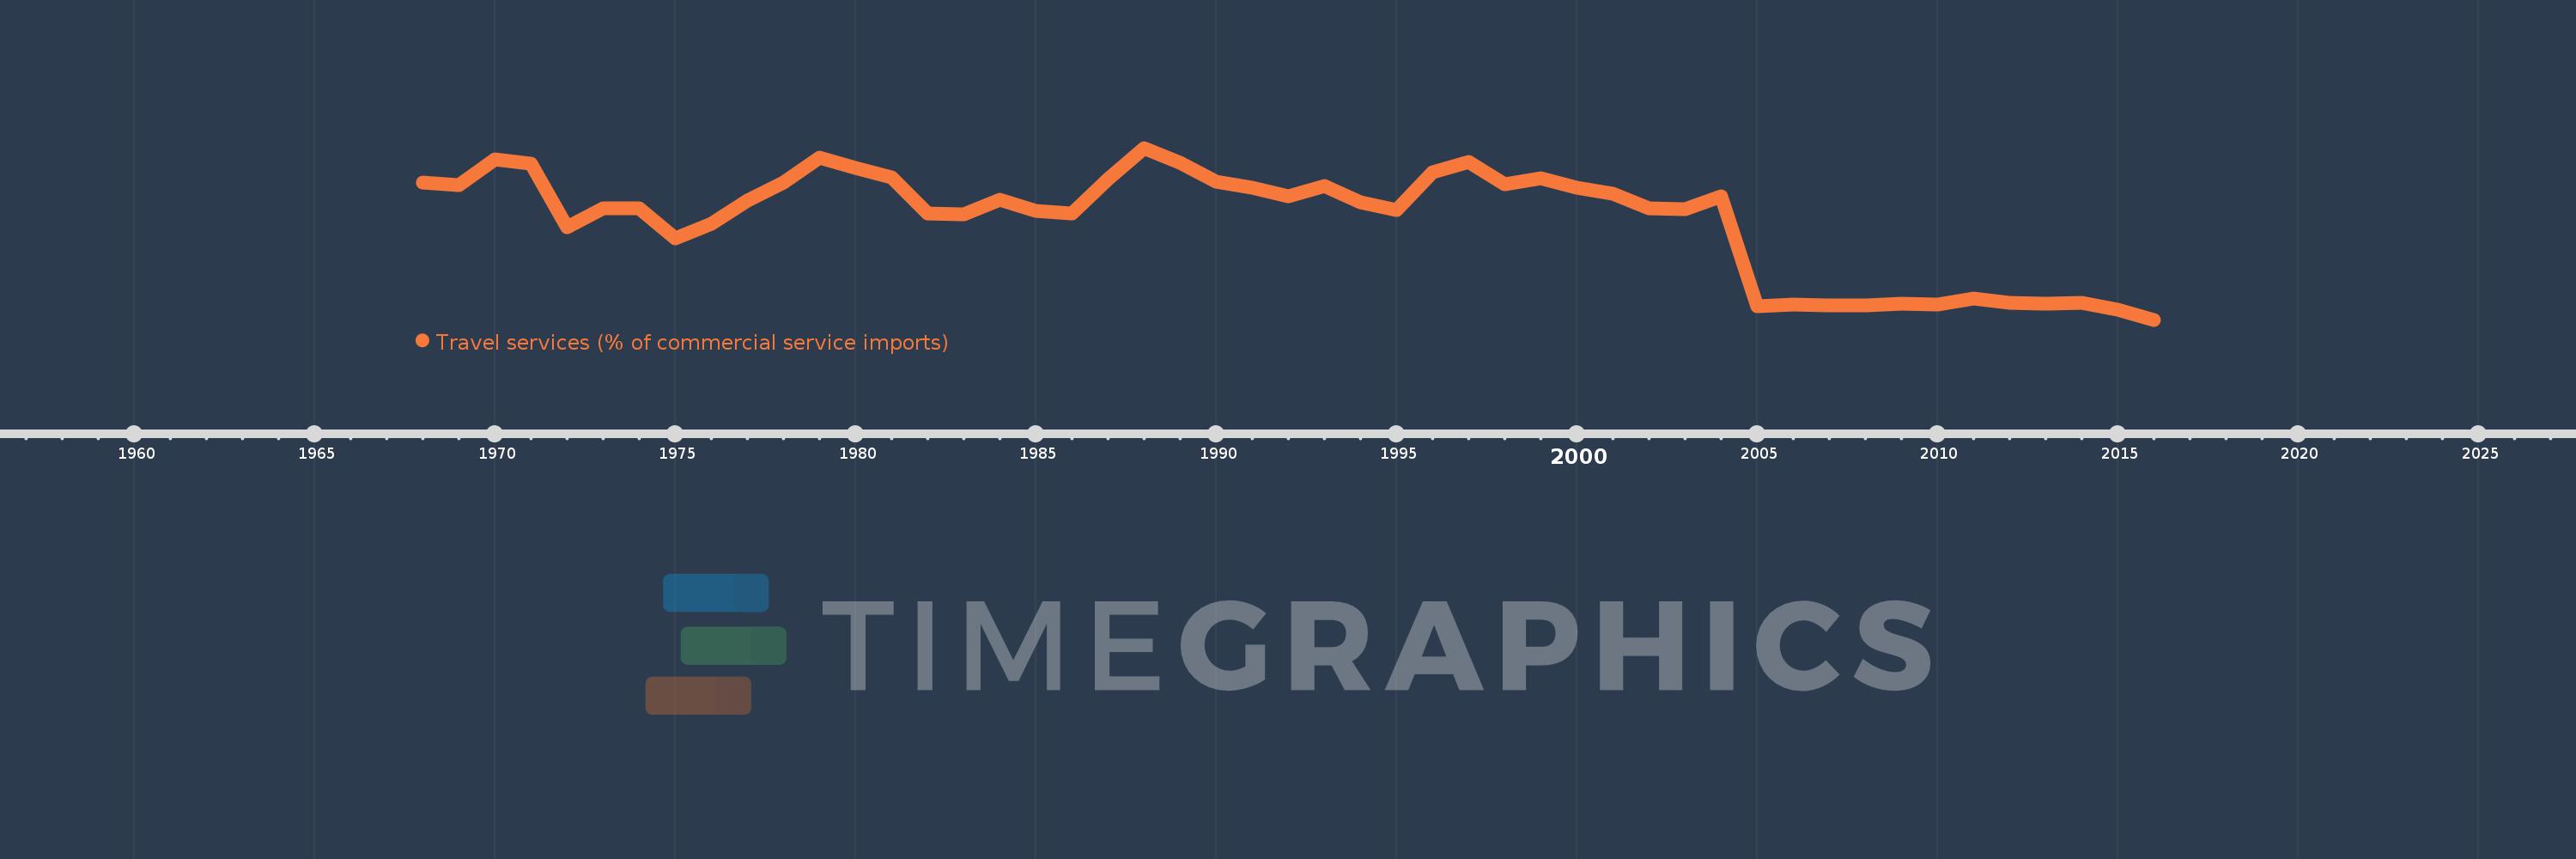
Travel services (% of commercial service imports)
2016,2015,2014,2013,2012,2011,2010,2009,2008,2007,2006,2005,2004,2003,2002,2001,2000,1999,1998,1997,1996,1995,1994,1993,1992,1991,1990,1989,1988,1987,1986,1985,1984,1983,1982,1981,1980,1979,1978,1977,1976,1975,1974,1973,1972,1971,1970,1969,1968
This statistics in other country:
AfghanistanAlbaniaAlgeriaAngolaAntigua and BarbudaArab WorldArgentinaArmeniaArubaAustraliaAustriaAzerbaijanBahamas, TheBahrainBangladeshBarbadosBelarusBelgiumBelizeBeninBermudaBhutanBoliviaBosnia and HerzegovinaBotswanaBrazilBrunei DarussalamBulgariaBurkina FasoBurundiCabo VerdeCambodiaCameroonCanadaCaribbean small statesCentral African RepublicCentral Europe and the BalticsChadChileChinaColombiaComorosCongo, Dem. Rep.Congo, Rep.Costa RicaCote d'IvoireCroatiaCuracaoCyprusCzech RepublicDenmarkDjiboutiDominicaDominican RepublicEarly-demographic dividendEast Asia & PacificEast Asia & Pacific (excluding high income)East Asia & Pacific (IDA & IBRD countries)EcuadorEgypt, Arab Rep.El SalvadorEritreaEstoniaEthiopiaEuro areaEurope & Central AsiaEurope & Central Asia (excluding high income)Europe & Central Asia (IDA & IBRD countries)European UnionFaroe IslandsFijiFinlandFragile and conflict affected situationsFranceFrench PolynesiaGabonGambia, TheGeorgiaGermanyGhanaGreeceGrenadaGuatemalaGuineaGuinea-BissauGuyanaHaitiHeavily indebted poor countries (HIPC)High incomeHondurasHong Kong SAR, ChinaHungaryIBRD onlyIcelandIDA & IBRD totalIDA onlyIDA totalIndiaIndonesiaIran, Islamic Rep.IraqIrelandIsraelItalyJamaicaJapanJordanKazakhstanKenyaKiribatiKorea, Rep.KosovoKuwaitKyrgyz RepublicLao PDRLate-demographic dividendLatin America & Caribbean Latin America & Caribbean (excluding high income)Latin America & the Caribbean (IDA & IBRD countries)LatviaLeast developed countries: UN classificationLebanonLesothoLiberiaLibyaLithuaniaLow & middle incomeLow incomeLower middle incomeLuxembourgMacao SAR, ChinaMacedonia, FYRMadagascarMalawiMalaysiaMaldivesMaliMaltaMarshall IslandsMauritaniaMauritiusMexicoMicronesia, Fed. Sts.Middle East & North AfricaMiddle East & North Africa (excluding high income)Middle East & North Africa (IDA & IBRD countries)Middle incomeMoldovaMongoliaMontenegroMoroccoMozambiqueMyanmarNamibiaNepalNetherlandsNew CaledoniaNew ZealandNicaraguaNigerNigeriaNorth AmericaNorwayOECD membersOmanOther small statesPacific island small statesPakistanPalauPanamaPapua New GuineaParaguayPeruPhilippinesPolandPortugalPost-demographic dividendPre-demographic dividendQatarRomaniaRussian FederationRwandaSamoaSao Tome and PrincipeSaudi ArabiaSenegalSerbiaSeychellesSierra LeoneSingaporeSint Maarten (Dutch part)Slovak RepublicSloveniaSmall statesSolomon IslandsSouth AfricaSouth AsiaSouth Asia (IDA & IBRD)South SudanSpainSri LankaSt. Kitts and NevisSt. LuciaSt. Vincent and the GrenadinesSub-Saharan Africa Sub-Saharan Africa (excluding high income)Sub-Saharan Africa (IDA & IBRD countries)SudanSurinameSwazilandSwedenSwitzerlandSyrian Arab RepublicTajikistanTanzaniaThailandTimor-LesteTogoTongaTrinidad and TobagoTunisiaTurkeyTuvaluUgandaUkraineUnited KingdomUnited StatesUpper middle incomeUruguayVanuatuVenezuela, RBWest Bank and GazaWorldYemen, Rep.ZambiaZimbabwe Timeline:
This timeline shows a graph from 1968 to 2016 of Netherlands. No data until 1967. Number of actual observations by date: 49.
Source name:
World Development Indicators
Source organization:
International Monetary Fund, Balance of Payments Statistics Yearbook and data files.
Categories, topics:
Private Sector, Trade
Last updated:
apr 23, 2017
Indicators value changes by year
Minimum:
12.092
jan 1, 2016
Maximum:
28.994
jan 1, 1988
At the date of observation
Value
Absolute change
Change from previous value
jan 1, 1968
25.625
+25.625
0.0%
jan 1, 1969
25.361
-0.264
-1.03%
jan 1, 1970
27.854
+2.492
9.83%
jan 1, 1971
27.427
-0.426
-1.53%
jan 1, 1972
21.184
-6.244
-22.76%
jan 1, 1973
23.063
+1.88
8.87%
jan 1, 1974
23.057
-0.006
-0.03%
jan 1, 1975
20.082
-2.975
-12.9%
jan 1, 1976
21.511
+1.429
7.11%
jan 1, 1977
23.781
+2.27
10.55%
jan 1, 1978
25.562
+1.78
7.49%
jan 1, 1979
28.077
+2.515
9.84%
jan 1, 1980
27.015
-1.062
-3.78%
jan 1, 1981
26.113
-0.902
-3.34%
jan 1, 1982
22.566
-3.547
-13.58%
jan 1, 1983
22.444
-0.122
-0.54%
jan 1, 1984
23.906
+1.462
6.51%
jan 1, 1985
22.783
-1.123
-4.7%
jan 1, 1986
22.517
-0.266
-1.17%
jan 1, 1987
25.968
+3.451
15.33%
jan 1, 1988
28.994
+3.026
11.65%
jan 1, 1989
27.554
-1.439
-4.96%
jan 1, 1990
25.652
-1.902
-6.9%
jan 1, 1991
25.122
-0.531
-2.07%
jan 1, 1992
24.246
-0.876
-3.49%
jan 1, 1993
25.219
+0.974
4.02%
jan 1, 1994
23.66
-1.56
-6.18%
jan 1, 1995
22.912
-0.747
-3.16%
jan 1, 1996
26.566
+3.653
15.95%
jan 1, 1997
27.602
+1.036
3.9%
jan 1, 1998
25.392
-2.21
-8.01%
jan 1, 1999
25.999
+0.607
2.39%
jan 1, 2000
25.096
-0.903
-3.47%
jan 1, 2001
24.521
-0.576
-2.29%
jan 1, 2002
23.05
-1.47
-6.0%
jan 1, 2003
22.997
-0.053
-0.23%
jan 1, 2004
24.213
+1.216
5.29%
jan 1, 2005
13.433
-10.78
-44.52%
jan 1, 2006
13.562
+0.129
0.96%
jan 1, 2007
13.536
-0.026
-0.19%
jan 1, 2008
13.481
-0.055
-0.41%
jan 1, 2009
13.65
+0.169
1.25%
jan 1, 2010
13.558
-0.093
-0.68%
jan 1, 2011
14.191
+0.633
4.67%
jan 1, 2012
13.743
-0.447
-3.15%
jan 1, 2013
13.657
-0.087
-0.63%
jan 1, 2014
13.736
+0.079
0.58%
jan 1, 2015
13.105
-0.631
-4.59%
jan 1, 2016
12.092
-1.012
-7.72%
Ranking of countries by current statistics by years


Comments: