29
/
en
AIzaSyAYiBZKx7MnpbEhh9jyipgxe19OcubqV5w
April 1, 2024
168333
Kenya
KEN
true
2
1
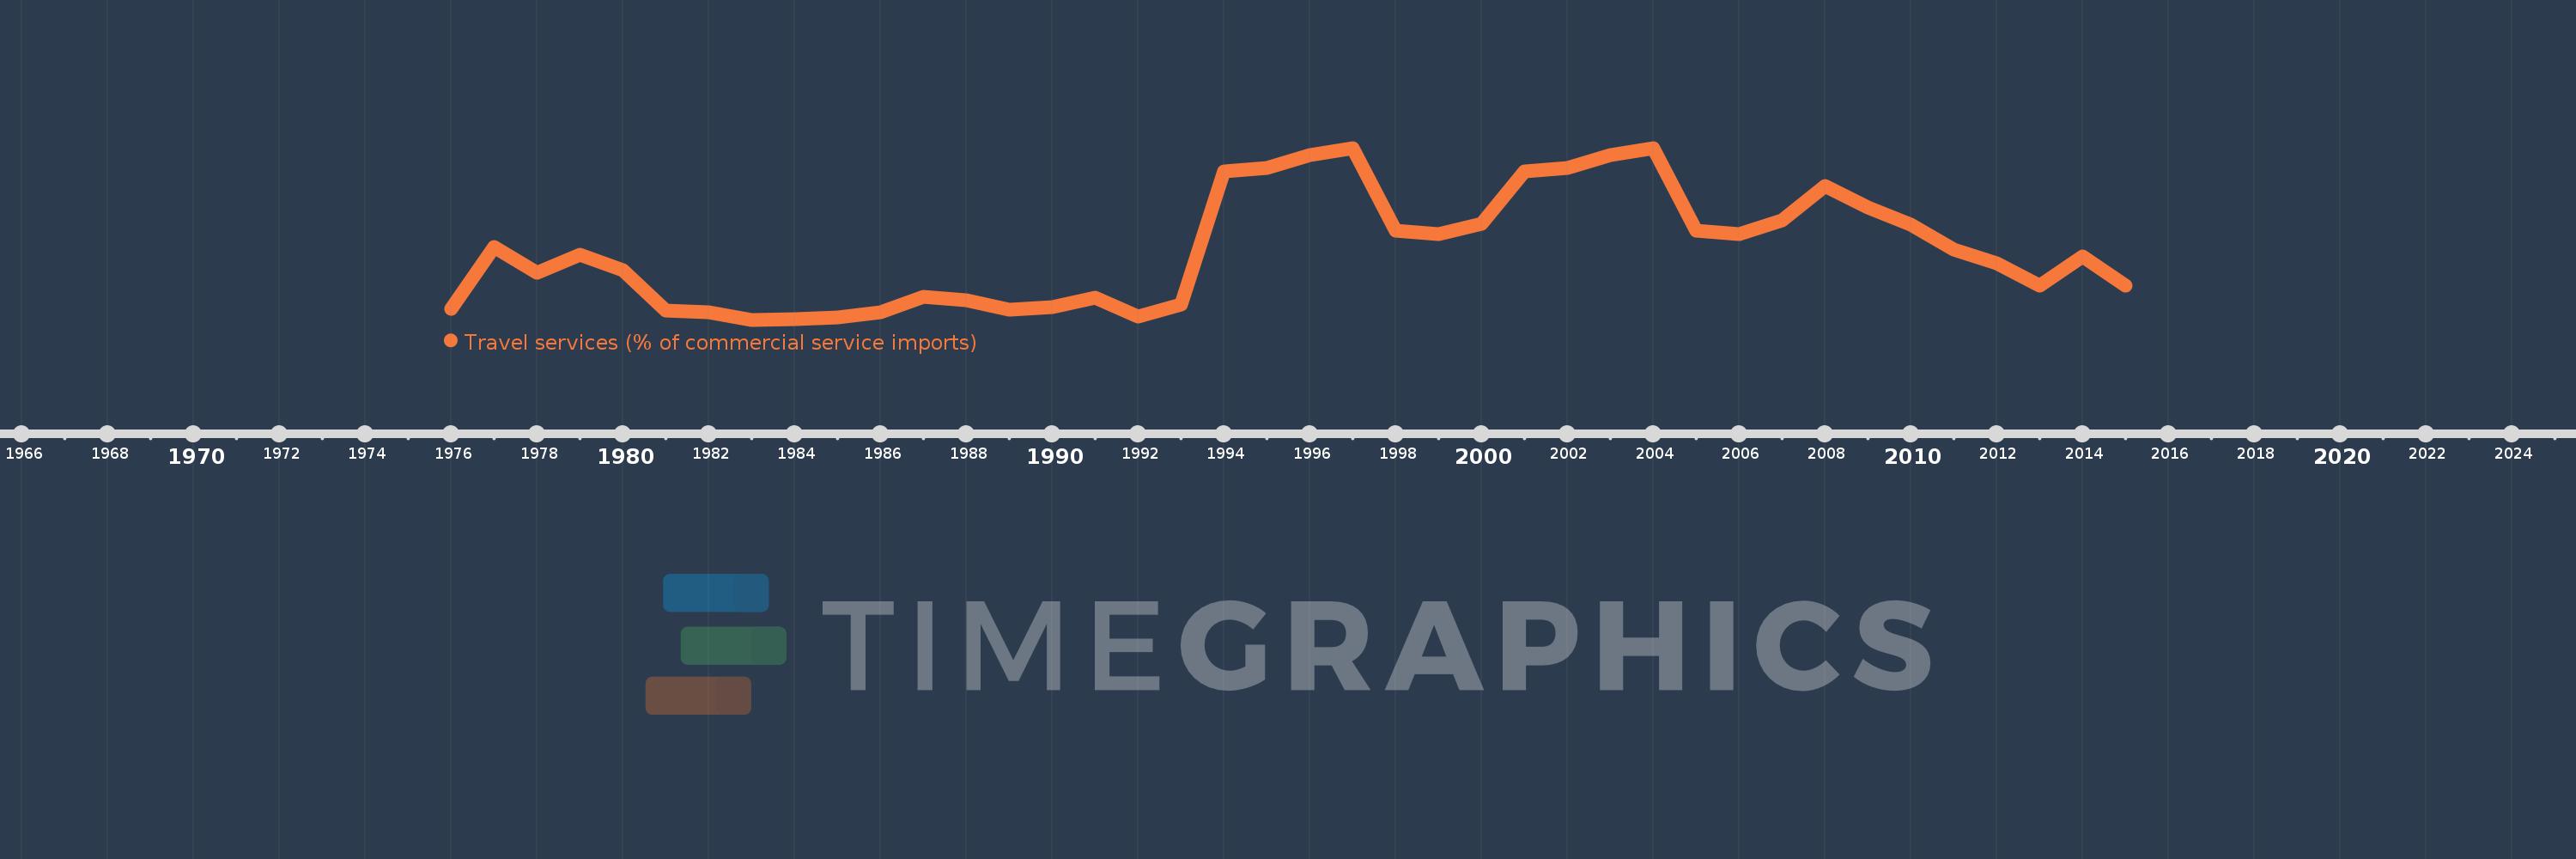
Travel services (% of commercial service imports)
2015,2014,2013,2012,2011,2010,2009,2008,2007,2006,2005,2004,2003,2002,2001,2000,1999,1998,1997,1996,1995,1994,1993,1992,1991,1990,1989,1988,1987,1986,1985,1984,1983,1982,1981,1980,1979,1978,1977,1976
This statistics in other country:
AfghanistanAlbaniaAlgeriaAngolaAntigua and BarbudaArab WorldArgentinaArmeniaArubaAustraliaAustriaAzerbaijanBahamas, TheBahrainBangladeshBarbadosBelarusBelgiumBelizeBeninBermudaBhutanBoliviaBosnia and HerzegovinaBotswanaBrazilBrunei DarussalamBulgariaBurkina FasoBurundiCabo VerdeCambodiaCameroonCanadaCaribbean small statesCentral African RepublicCentral Europe and the BalticsChadChileChinaColombiaComorosCongo, Dem. Rep.Congo, Rep.Costa RicaCote d'IvoireCroatiaCuracaoCyprusCzech RepublicDenmarkDjiboutiDominicaDominican RepublicEarly-demographic dividendEast Asia & PacificEast Asia & Pacific (excluding high income)East Asia & Pacific (IDA & IBRD countries)EcuadorEgypt, Arab Rep.El SalvadorEritreaEstoniaEthiopiaEuro areaEurope & Central AsiaEurope & Central Asia (excluding high income)Europe & Central Asia (IDA & IBRD countries)European UnionFaroe IslandsFijiFinlandFragile and conflict affected situationsFranceFrench PolynesiaGabonGambia, TheGeorgiaGermanyGhanaGreeceGrenadaGuatemalaGuineaGuinea-BissauGuyanaHaitiHeavily indebted poor countries (HIPC)High incomeHondurasHong Kong SAR, ChinaHungaryIBRD onlyIcelandIDA & IBRD totalIDA onlyIDA totalIndiaIndonesiaIran, Islamic Rep.IraqIrelandIsraelItalyJamaicaJapanJordanKazakhstanKenyaKiribatiKorea, Rep.KosovoKuwaitKyrgyz RepublicLao PDRLate-demographic dividendLatin America & Caribbean Latin America & Caribbean (excluding high income)Latin America & the Caribbean (IDA & IBRD countries)LatviaLeast developed countries: UN classificationLebanonLesothoLiberiaLibyaLithuaniaLow & middle incomeLow incomeLower middle incomeLuxembourgMacao SAR, ChinaMacedonia, FYRMadagascarMalawiMalaysiaMaldivesMaliMaltaMarshall IslandsMauritaniaMauritiusMexicoMicronesia, Fed. Sts.Middle East & North AfricaMiddle East & North Africa (excluding high income)Middle East & North Africa (IDA & IBRD countries)Middle incomeMoldovaMongoliaMontenegroMoroccoMozambiqueMyanmarNamibiaNepalNetherlandsNew CaledoniaNew ZealandNicaraguaNigerNigeriaNorth AmericaNorwayOECD membersOmanOther small statesPacific island small statesPakistanPalauPanamaPapua New GuineaParaguayPeruPhilippinesPolandPortugalPost-demographic dividendPre-demographic dividendQatarRomaniaRussian FederationRwandaSamoaSao Tome and PrincipeSaudi ArabiaSenegalSerbiaSeychellesSierra LeoneSingaporeSint Maarten (Dutch part)Slovak RepublicSloveniaSmall statesSolomon IslandsSouth AfricaSouth AsiaSouth Asia (IDA & IBRD)South SudanSpainSri LankaSt. Kitts and NevisSt. LuciaSt. Vincent and the GrenadinesSub-Saharan Africa Sub-Saharan Africa (excluding high income)Sub-Saharan Africa (IDA & IBRD countries)SudanSurinameSwazilandSwedenSwitzerlandSyrian Arab RepublicTajikistanTanzaniaThailandTimor-LesteTogoTongaTrinidad and TobagoTunisiaTurkeyTuvaluUgandaUkraineUnited KingdomUnited StatesUpper middle incomeUruguayVanuatuVenezuela, RBWest Bank and GazaWorldYemen, Rep.ZambiaZimbabwe Timeline:
This timeline shows a graph from 1976 to 2015 of Kenya. No data until 1975. Number of actual observations by date: 40.
Source name:
World Development Indicators
Source organization:
International Monetary Fund, Balance of Payments Statistics Yearbook and data files.
Categories, topics:
Private Sector, Trade
Last updated:
apr 23, 2017
Indicators value changes by year
Maximum:
21.512
jan 1, 1997
At the date of observation
Value
Absolute change
Change from previous value
jan 1, 1976
5.205
+5.205
0.0%
jan 1, 1977
11.537
+6.332
121.65%
jan 1, 1978
8.925
-2.611
-22.63%
jan 1, 1979
10.671
+1.746
19.56%
jan 1, 1980
9.176
-1.495
-14.01%
jan 1, 1981
5.023
-4.152
-45.25%
jan 1, 1982
4.85
-0.173
-3.45%
jan 1, 1983
4.136
-0.714
-14.71%
jan 1, 1984
4.208
+0.072
1.73%
jan 1, 1985
4.356
+0.148
3.52%
jan 1, 1986
4.902
+0.546
12.53%
jan 1, 1987
6.436
+1.533
31.28%
jan 1, 1988
6.116
-0.319
-4.96%
jan 1, 1989
5.188
-0.928
-15.17%
jan 1, 1990
5.37
+0.181
3.5%
jan 1, 1991
6.404
+1.034
19.26%
jan 1, 1992
4.436
-1.968
-30.73%
jan 1, 1993
5.707
+1.272
28.67%
jan 1, 1994
19.126
+13.418
235.1%
jan 1, 1995
19.457
+0.331
1.73%
jan 1, 1996
20.759
+1.302
6.69%
jan 1, 1997
21.512
+0.753
3.63%
jan 1, 1998
13.133
-8.379
-38.95%
jan 1, 1999
12.767
-0.366
-2.79%
jan 1, 2000
13.871
+1.104
8.65%
jan 1, 2001
19.126
+5.254
37.88%
jan 1, 2002
19.457
+0.331
1.73%
jan 1, 2003
20.759
+1.302
6.69%
jan 1, 2004
21.512
+0.753
3.63%
jan 1, 2005
13.128
-8.384
-38.97%
jan 1, 2006
12.774
-0.354
-2.69%
jan 1, 2007
14.201
+1.427
11.17%
jan 1, 2008
17.65
+3.449
24.29%
jan 1, 2009
15.477
-2.173
-12.31%
jan 1, 2010
13.718
-1.758
-11.36%
jan 1, 2011
11.211
-2.507
-18.28%
jan 1, 2012
9.841
-1.37
-12.22%
jan 1, 2013
7.61
-2.231
-22.67%
jan 1, 2014
10.568
+2.958
38.87%
jan 1, 2015
7.625
-2.943
-27.85%
Ranking of countries by current statistics by years


Comments: