29
/
en
AIzaSyAYiBZKx7MnpbEhh9jyipgxe19OcubqV5w
April 1, 2024
36273
High income
HIC
false
2
1
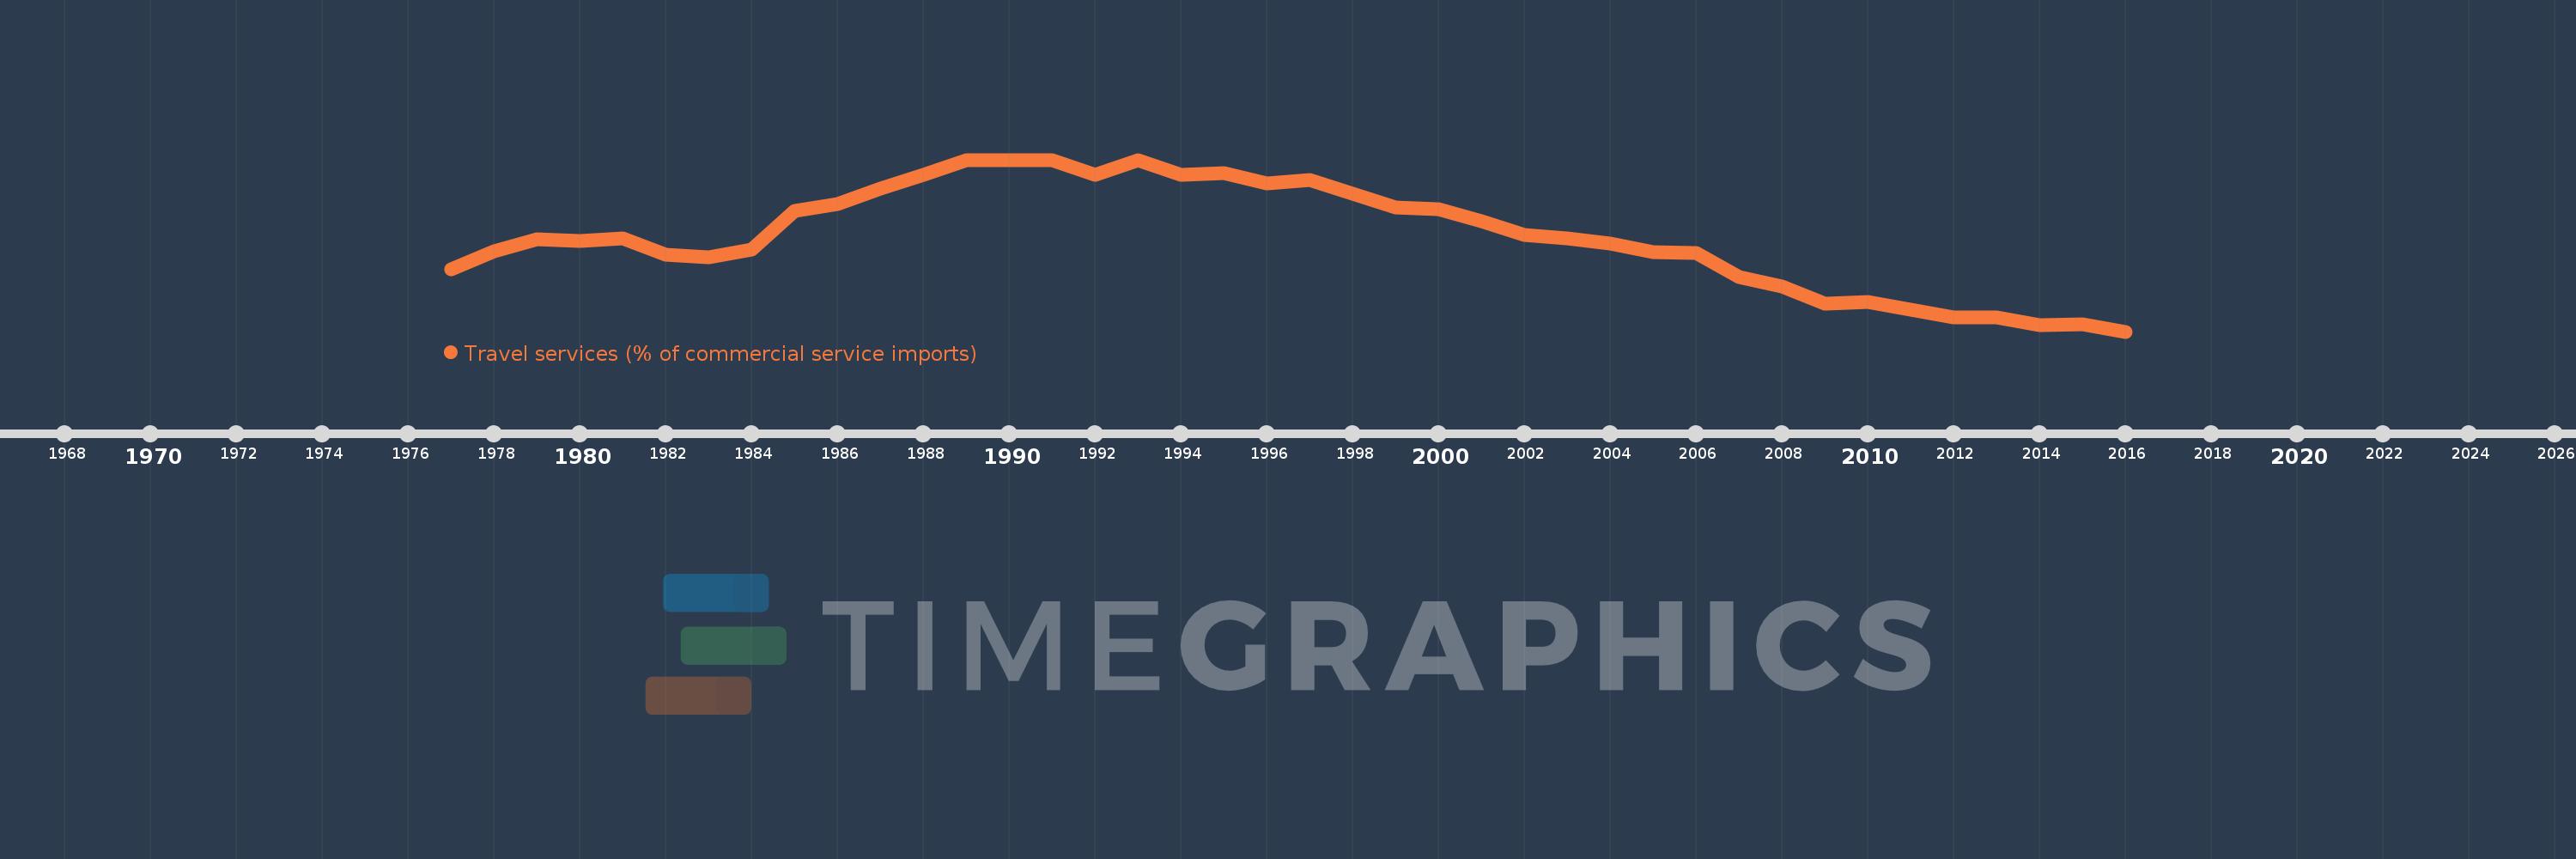
Travel services (% of commercial service imports)
2016,2015,2014,2013,2012,2011,2010,2009,2008,2007,2006,2005,2004,2003,2002,2001,2000,1999,1998,1997,1996,1995,1994,1993,1992,1991,1990,1989,1988,1987,1986,1985,1984,1983,1982,1981,1980,1979,1978,1977
This statistics in other country:
AfghanistanAlbaniaAlgeriaAngolaAntigua and BarbudaArab WorldArgentinaArmeniaArubaAustraliaAustriaAzerbaijanBahamas, TheBahrainBangladeshBarbadosBelarusBelgiumBelizeBeninBermudaBhutanBoliviaBosnia and HerzegovinaBotswanaBrazilBrunei DarussalamBulgariaBurkina FasoBurundiCabo VerdeCambodiaCameroonCanadaCaribbean small statesCentral African RepublicCentral Europe and the BalticsChadChileChinaColombiaComorosCongo, Dem. Rep.Congo, Rep.Costa RicaCote d'IvoireCroatiaCuracaoCyprusCzech RepublicDenmarkDjiboutiDominicaDominican RepublicEarly-demographic dividendEast Asia & PacificEast Asia & Pacific (excluding high income)East Asia & Pacific (IDA & IBRD countries)EcuadorEgypt, Arab Rep.El SalvadorEritreaEstoniaEthiopiaEuro areaEurope & Central AsiaEurope & Central Asia (excluding high income)Europe & Central Asia (IDA & IBRD countries)European UnionFaroe IslandsFijiFinlandFragile and conflict affected situationsFranceFrench PolynesiaGabonGambia, TheGeorgiaGermanyGhanaGreeceGrenadaGuatemalaGuineaGuinea-BissauGuyanaHaitiHeavily indebted poor countries (HIPC)High incomeHondurasHong Kong SAR, ChinaHungaryIBRD onlyIcelandIDA & IBRD totalIDA onlyIDA totalIndiaIndonesiaIran, Islamic Rep.IraqIrelandIsraelItalyJamaicaJapanJordanKazakhstanKenyaKiribatiKorea, Rep.KosovoKuwaitKyrgyz RepublicLao PDRLate-demographic dividendLatin America & Caribbean Latin America & Caribbean (excluding high income)Latin America & the Caribbean (IDA & IBRD countries)LatviaLeast developed countries: UN classificationLebanonLesothoLiberiaLibyaLithuaniaLow & middle incomeLow incomeLower middle incomeLuxembourgMacao SAR, ChinaMacedonia, FYRMadagascarMalawiMalaysiaMaldivesMaliMaltaMarshall IslandsMauritaniaMauritiusMexicoMicronesia, Fed. Sts.Middle East & North AfricaMiddle East & North Africa (excluding high income)Middle East & North Africa (IDA & IBRD countries)Middle incomeMoldovaMongoliaMontenegroMoroccoMozambiqueMyanmarNamibiaNepalNetherlandsNew CaledoniaNew ZealandNicaraguaNigerNigeriaNorth AmericaNorwayOECD membersOmanOther small statesPacific island small statesPakistanPalauPanamaPapua New GuineaParaguayPeruPhilippinesPolandPortugalPost-demographic dividendPre-demographic dividendQatarRomaniaRussian FederationRwandaSamoaSao Tome and PrincipeSaudi ArabiaSenegalSerbiaSeychellesSierra LeoneSingaporeSint Maarten (Dutch part)Slovak RepublicSloveniaSmall statesSolomon IslandsSouth AfricaSouth AsiaSouth Asia (IDA & IBRD)South SudanSpainSri LankaSt. Kitts and NevisSt. LuciaSt. Vincent and the GrenadinesSub-Saharan Africa Sub-Saharan Africa (excluding high income)Sub-Saharan Africa (IDA & IBRD countries)SudanSurinameSwazilandSwedenSwitzerlandSyrian Arab RepublicTajikistanTanzaniaThailandTimor-LesteTogoTongaTrinidad and TobagoTunisiaTurkeyTuvaluUgandaUkraineUnited KingdomUnited StatesUpper middle incomeUruguayVanuatuVenezuela, RBWest Bank and GazaWorldYemen, Rep.ZambiaZimbabwe Timeline:
This timeline shows a graph from 1977 to 2016 of High income. No data until 1976. Number of actual observations by date: 40.
Source name:
World Development Indicators
Source organization:
International Monetary Fund, Balance of Payments Statistics Yearbook and data files.
Categories, topics:
Private Sector, Trade
Last updated:
apr 23, 2017
Indicators value changes by year
Minimum:
22.423
jan 1, 2016
Maximum:
33.935
jan 1, 1990
At the date of observation
Value
Absolute change
Change from previous value
jan 1, 1977
26.57
+26.57
0.0%
jan 1, 1978
27.798
+1.228
4.62%
jan 1, 1979
28.624
+0.825
2.97%
jan 1, 1980
28.493
-0.13
-0.46%
jan 1, 1981
28.691
+0.198
0.7%
jan 1, 1982
27.583
-1.109
-3.86%
jan 1, 1983
27.428
-0.155
-0.56%
jan 1, 1984
27.897
+0.469
1.71%
jan 1, 1985
30.489
+2.593
9.29%
jan 1, 1986
30.951
+0.461
1.51%
jan 1, 1987
32.005
+1.054
3.41%
jan 1, 1988
32.944
+0.939
2.93%
jan 1, 1989
33.884
+0.94
2.85%
jan 1, 1990
33.935
+0.051
0.15%
jan 1, 1991
33.9
-0.035
-0.1%
jan 1, 1992
32.95
-0.95
-2.8%
jan 1, 1993
33.885
+0.934
2.84%
jan 1, 1994
32.938
-0.947
-2.79%
jan 1, 1995
33.028
+0.09
0.27%
jan 1, 1996
32.358
-0.67
-2.03%
jan 1, 1997
32.556
+0.198
0.61%
jan 1, 1998
31.684
-0.872
-2.68%
jan 1, 1999
30.736
-0.948
-2.99%
jan 1, 2000
30.609
-0.127
-0.41%
jan 1, 2001
29.845
-0.764
-2.49%
jan 1, 2002
28.877
-0.968
-3.24%
jan 1, 2003
28.681
-0.196
-0.68%
jan 1, 2004
28.307
-0.375
-1.31%
jan 1, 2005
27.759
-0.548
-1.94%
jan 1, 2006
27.673
-0.085
-0.31%
jan 1, 2007
26.106
-1.567
-5.66%
jan 1, 2008
25.467
-0.64
-2.45%
jan 1, 2009
24.322
-1.145
-4.49%
jan 1, 2010
24.399
+0.077
0.32%
jan 1, 2011
23.864
-0.534
-2.19%
jan 1, 2012
23.4
-0.465
-1.95%
jan 1, 2013
23.347
-0.053
-0.23%
jan 1, 2014
22.853
-0.494
-2.12%
jan 1, 2015
22.933
+0.08
0.35%
jan 1, 2016
22.423
-0.51
-2.22%
Ranking of countries by current statistics by years


Comments: