29
/
en
AIzaSyAYiBZKx7MnpbEhh9jyipgxe19OcubqV5w
April 1, 2024
180475
Libya
LBY
true
2
1
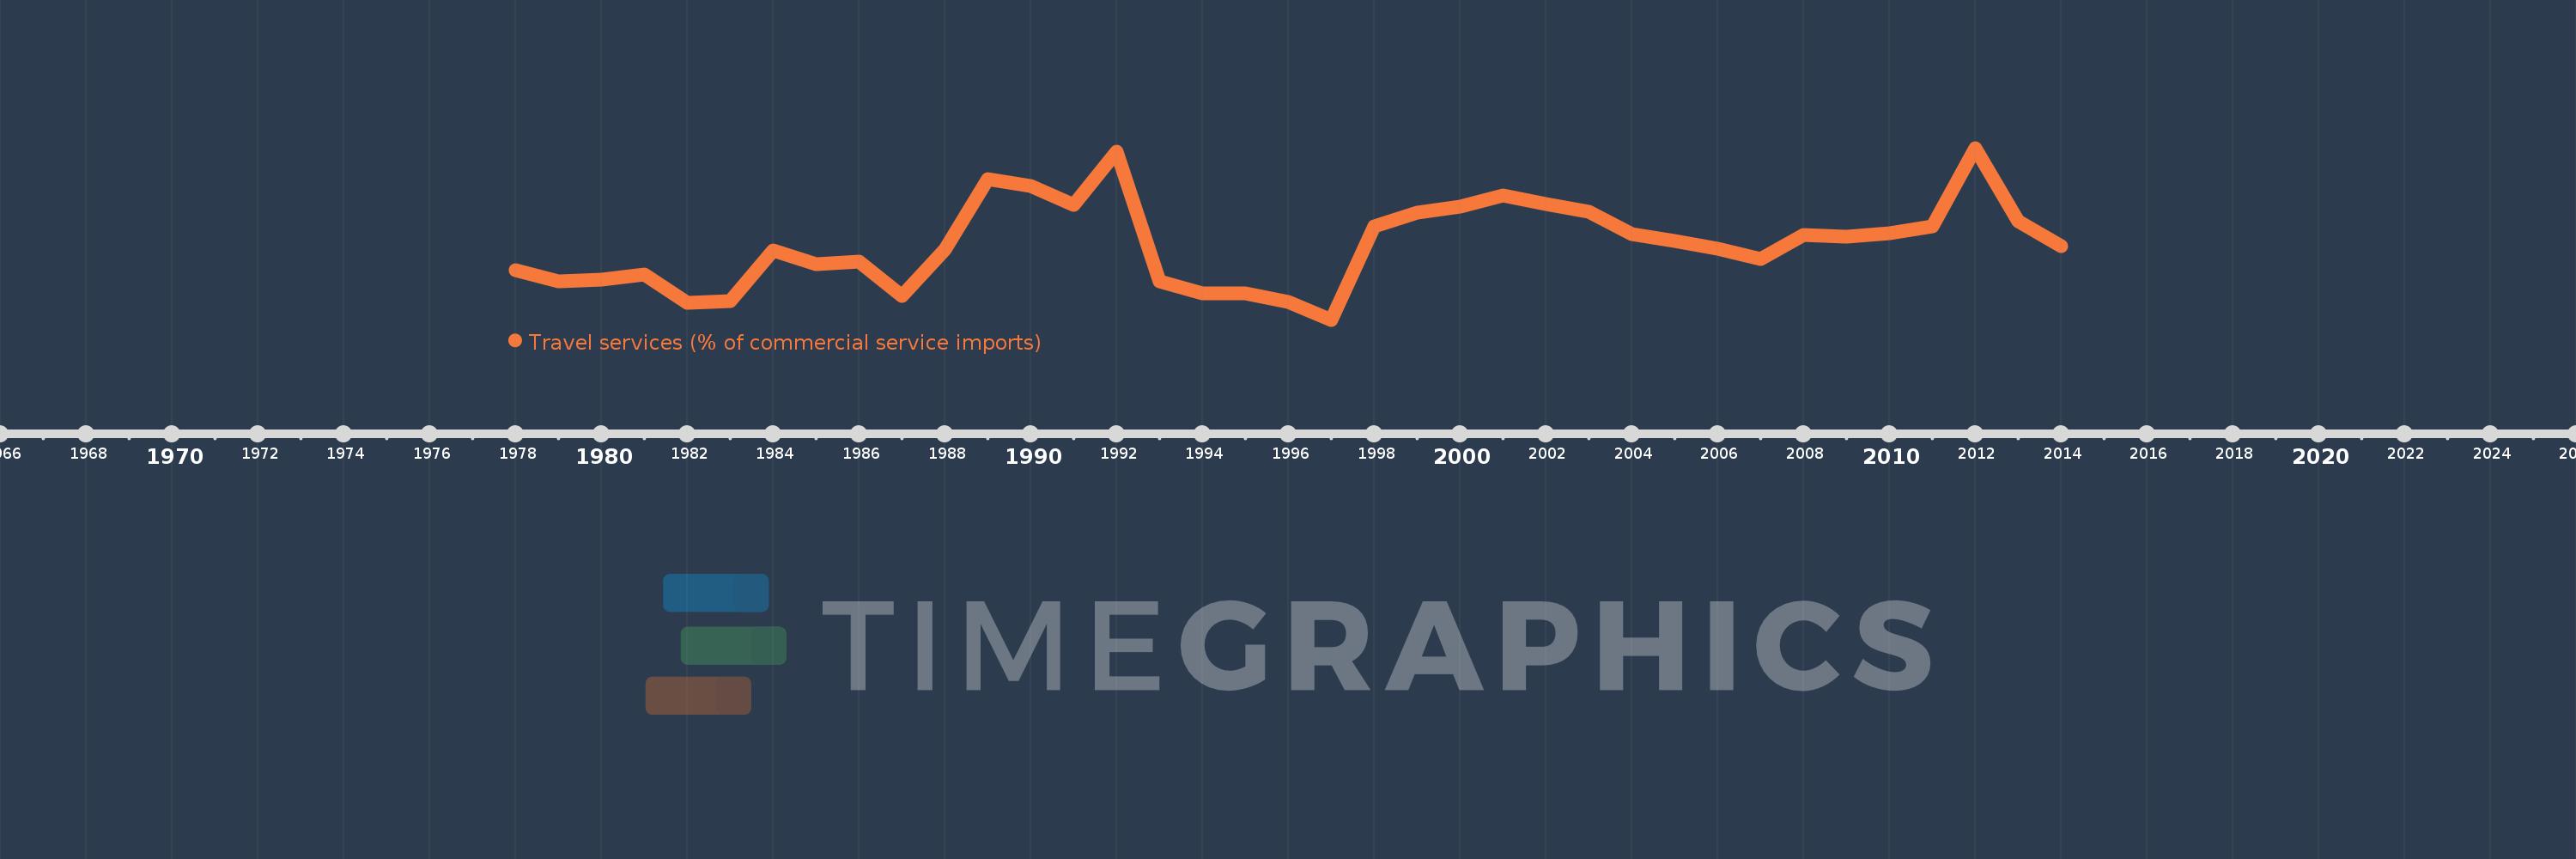
Travel services (% of commercial service imports)
2014,2013,2012,2011,2010,2009,2008,2007,2006,2005,2004,2003,2002,2001,2000,1999,1998,1997,1996,1995,1994,1993,1992,1991,1990,1989,1988,1987,1986,1985,1984,1983,1982,1981,1980,1979,1978
This statistics in other country:
AfghanistanAlbaniaAlgeriaAngolaAntigua and BarbudaArab WorldArgentinaArmeniaArubaAustraliaAustriaAzerbaijanBahamas, TheBahrainBangladeshBarbadosBelarusBelgiumBelizeBeninBermudaBhutanBoliviaBosnia and HerzegovinaBotswanaBrazilBrunei DarussalamBulgariaBurkina FasoBurundiCabo VerdeCambodiaCameroonCanadaCaribbean small statesCentral African RepublicCentral Europe and the BalticsChadChileChinaColombiaComorosCongo, Dem. Rep.Congo, Rep.Costa RicaCote d'IvoireCroatiaCuracaoCyprusCzech RepublicDenmarkDjiboutiDominicaDominican RepublicEarly-demographic dividendEast Asia & PacificEast Asia & Pacific (excluding high income)East Asia & Pacific (IDA & IBRD countries)EcuadorEgypt, Arab Rep.El SalvadorEritreaEstoniaEthiopiaEuro areaEurope & Central AsiaEurope & Central Asia (excluding high income)Europe & Central Asia (IDA & IBRD countries)European UnionFaroe IslandsFijiFinlandFragile and conflict affected situationsFranceFrench PolynesiaGabonGambia, TheGeorgiaGermanyGhanaGreeceGrenadaGuatemalaGuineaGuinea-BissauGuyanaHaitiHeavily indebted poor countries (HIPC)High incomeHondurasHong Kong SAR, ChinaHungaryIBRD onlyIcelandIDA & IBRD totalIDA onlyIDA totalIndiaIndonesiaIran, Islamic Rep.IraqIrelandIsraelItalyJamaicaJapanJordanKazakhstanKenyaKiribatiKorea, Rep.KosovoKuwaitKyrgyz RepublicLao PDRLate-demographic dividendLatin America & Caribbean Latin America & Caribbean (excluding high income)Latin America & the Caribbean (IDA & IBRD countries)LatviaLeast developed countries: UN classificationLebanonLesothoLiberiaLibyaLithuaniaLow & middle incomeLow incomeLower middle incomeLuxembourgMacao SAR, ChinaMacedonia, FYRMadagascarMalawiMalaysiaMaldivesMaliMaltaMarshall IslandsMauritaniaMauritiusMexicoMicronesia, Fed. Sts.Middle East & North AfricaMiddle East & North Africa (excluding high income)Middle East & North Africa (IDA & IBRD countries)Middle incomeMoldovaMongoliaMontenegroMoroccoMozambiqueMyanmarNamibiaNepalNetherlandsNew CaledoniaNew ZealandNicaraguaNigerNigeriaNorth AmericaNorwayOECD membersOmanOther small statesPacific island small statesPakistanPalauPanamaPapua New GuineaParaguayPeruPhilippinesPolandPortugalPost-demographic dividendPre-demographic dividendQatarRomaniaRussian FederationRwandaSamoaSao Tome and PrincipeSaudi ArabiaSenegalSerbiaSeychellesSierra LeoneSingaporeSint Maarten (Dutch part)Slovak RepublicSloveniaSmall statesSolomon IslandsSouth AfricaSouth AsiaSouth Asia (IDA & IBRD)South SudanSpainSri LankaSt. Kitts and NevisSt. LuciaSt. Vincent and the GrenadinesSub-Saharan Africa Sub-Saharan Africa (excluding high income)Sub-Saharan Africa (IDA & IBRD countries)SudanSurinameSwazilandSwedenSwitzerlandSyrian Arab RepublicTajikistanTanzaniaThailandTimor-LesteTogoTongaTrinidad and TobagoTunisiaTurkeyTuvaluUgandaUkraineUnited KingdomUnited StatesUpper middle incomeUruguayVanuatuVenezuela, RBWest Bank and GazaWorldYemen, Rep.ZambiaZimbabwe Timeline:
This timeline shows a graph from 1978 to 2014 of Libya. No data until 1977. Number of actual observations by date: 37.
Source name:
World Development Indicators
Source organization:
International Monetary Fund, Balance of Payments Statistics Yearbook and data files.
Categories, topics:
Private Sector, Trade
Last updated:
apr 23, 2017
Indicators value changes by year
Maximum:
63.832
jan 1, 2012
At the date of observation
Value
Absolute change
Change from previous value
jan 1, 1978
24.992
+24.992
0.0%
jan 1, 1979
21.553
-3.439
-13.76%
jan 1, 1980
22.112
+0.558
2.59%
jan 1, 1981
23.639
+1.528
6.91%
jan 1, 1982
14.78
-8.859
-37.48%
jan 1, 1983
15.198
+0.418
2.83%
jan 1, 1984
31.437
+16.238
106.84%
jan 1, 1985
26.989
-4.447
-14.15%
jan 1, 1986
27.925
+0.936
3.47%
jan 1, 1987
16.828
-11.097
-39.74%
jan 1, 1988
31.642
+14.814
88.04%
jan 1, 1989
53.823
+22.18
70.1%
jan 1, 1990
51.685
-2.138
-3.97%
jan 1, 1991
45.749
-5.935
-11.48%
jan 1, 1992
62.624
+16.875
36.89%
jan 1, 1993
21.648
-40.976
-65.43%
jan 1, 1994
17.89
-3.758
-17.36%
jan 1, 1995
17.86
-0.03
-0.17%
jan 1, 1996
14.955
-2.905
-16.26%
jan 1, 1997
9.409
-5.546
-37.09%
jan 1, 1998
38.871
+29.462
313.13%
jan 1, 1999
43.209
+4.338
11.16%
jan 1, 2000
45.32
+2.11
4.88%
jan 1, 2001
48.712
+3.392
7.48%
jan 1, 2002
46.162
-2.55
-5.23%
jan 1, 2003
43.634
-2.528
-5.48%
jan 1, 2004
36.453
-7.181
-16.46%
jan 1, 2005
34.398
-2.055
-5.64%
jan 1, 2006
31.955
-2.443
-7.1%
jan 1, 2007
28.744
-3.211
-10.05%
jan 1, 2008
36.221
+7.477
26.01%
jan 1, 2009
35.762
-0.459
-1.27%
jan 1, 2010
36.704
+0.942
2.63%
jan 1, 2011
38.984
+2.28
6.21%
jan 1, 2012
63.832
+24.848
63.74%
jan 1, 2013
40.719
-23.113
-36.21%
jan 1, 2014
32.827
-7.891
-19.38%
Ranking of countries by current statistics by years


Comments: