29
/
en
AIzaSyAYiBZKx7MnpbEhh9jyipgxe19OcubqV5w
April 1, 2024
161094
Israel
ISR
true
2
1
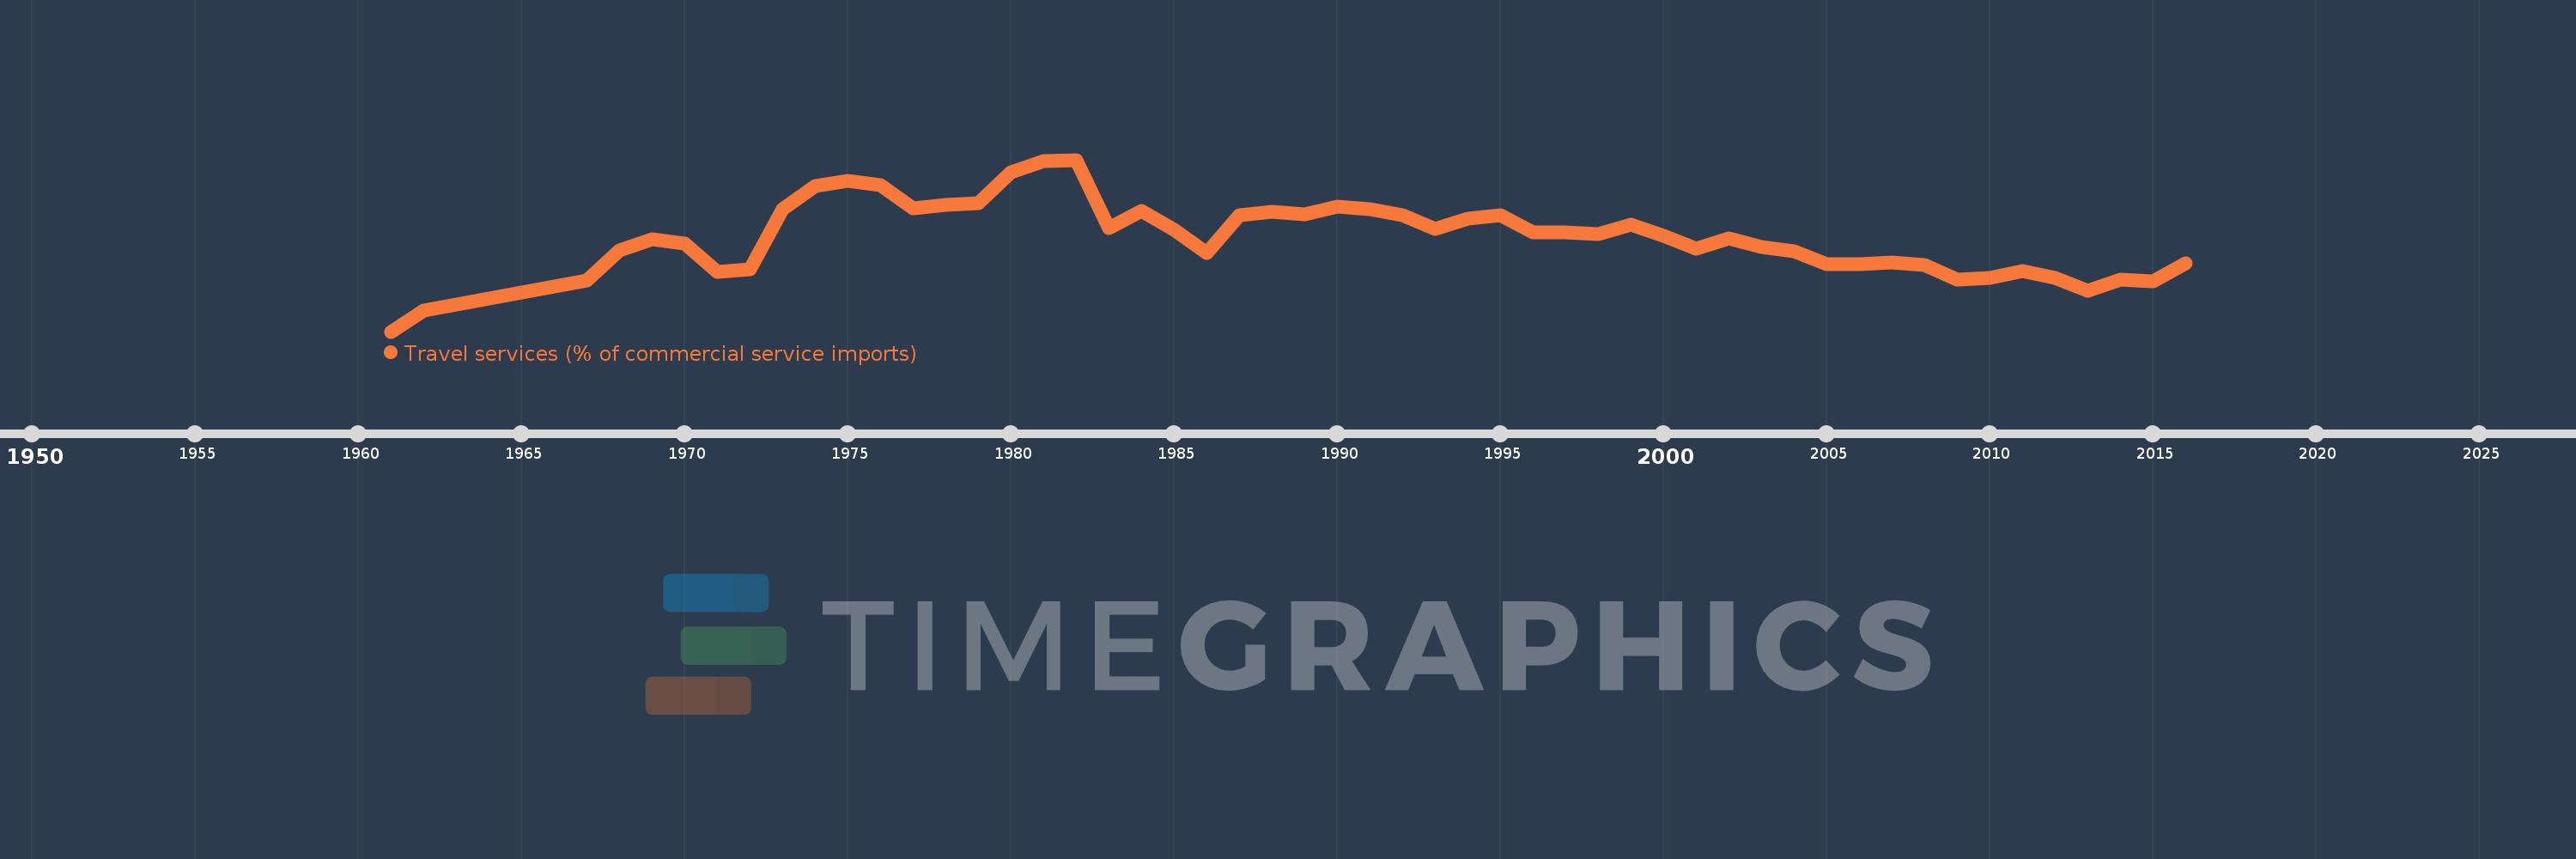
Travel services (% of commercial service imports)
2016,2015,2014,2013,2012,2011,2010,2009,2008,2007,2006,2005,2004,2003,2002,2001,2000,1999,1998,1997,1996,1995,1994,1993,1992,1991,1990,1989,1988,1987,1986,1985,1984,1983,1982,1981,1980,1979,1978,1977,1976,1975,1974,1973,1972,1971,1970,1969,1968,1967,1966,1962,1961
This statistics in other country:
AfghanistanAlbaniaAlgeriaAngolaAntigua and BarbudaArab WorldArgentinaArmeniaArubaAustraliaAustriaAzerbaijanBahamas, TheBahrainBangladeshBarbadosBelarusBelgiumBelizeBeninBermudaBhutanBoliviaBosnia and HerzegovinaBotswanaBrazilBrunei DarussalamBulgariaBurkina FasoBurundiCabo VerdeCambodiaCameroonCanadaCaribbean small statesCentral African RepublicCentral Europe and the BalticsChadChileChinaColombiaComorosCongo, Dem. Rep.Congo, Rep.Costa RicaCote d'IvoireCroatiaCuracaoCyprusCzech RepublicDenmarkDjiboutiDominicaDominican RepublicEarly-demographic dividendEast Asia & PacificEast Asia & Pacific (excluding high income)East Asia & Pacific (IDA & IBRD countries)EcuadorEgypt, Arab Rep.El SalvadorEritreaEstoniaEthiopiaEuro areaEurope & Central AsiaEurope & Central Asia (excluding high income)Europe & Central Asia (IDA & IBRD countries)European UnionFaroe IslandsFijiFinlandFragile and conflict affected situationsFranceFrench PolynesiaGabonGambia, TheGeorgiaGermanyGhanaGreeceGrenadaGuatemalaGuineaGuinea-BissauGuyanaHaitiHeavily indebted poor countries (HIPC)High incomeHondurasHong Kong SAR, ChinaHungaryIBRD onlyIcelandIDA & IBRD totalIDA onlyIDA totalIndiaIndonesiaIran, Islamic Rep.IraqIrelandIsraelItalyJamaicaJapanJordanKazakhstanKenyaKiribatiKorea, Rep.KosovoKuwaitKyrgyz RepublicLao PDRLate-demographic dividendLatin America & Caribbean Latin America & Caribbean (excluding high income)Latin America & the Caribbean (IDA & IBRD countries)LatviaLeast developed countries: UN classificationLebanonLesothoLiberiaLibyaLithuaniaLow & middle incomeLow incomeLower middle incomeLuxembourgMacao SAR, ChinaMacedonia, FYRMadagascarMalawiMalaysiaMaldivesMaliMaltaMarshall IslandsMauritaniaMauritiusMexicoMicronesia, Fed. Sts.Middle East & North AfricaMiddle East & North Africa (excluding high income)Middle East & North Africa (IDA & IBRD countries)Middle incomeMoldovaMongoliaMontenegroMoroccoMozambiqueMyanmarNamibiaNepalNetherlandsNew CaledoniaNew ZealandNicaraguaNigerNigeriaNorth AmericaNorwayOECD membersOmanOther small statesPacific island small statesPakistanPalauPanamaPapua New GuineaParaguayPeruPhilippinesPolandPortugalPost-demographic dividendPre-demographic dividendQatarRomaniaRussian FederationRwandaSamoaSao Tome and PrincipeSaudi ArabiaSenegalSerbiaSeychellesSierra LeoneSingaporeSint Maarten (Dutch part)Slovak RepublicSloveniaSmall statesSolomon IslandsSouth AfricaSouth AsiaSouth Asia (IDA & IBRD)South SudanSpainSri LankaSt. Kitts and NevisSt. LuciaSt. Vincent and the GrenadinesSub-Saharan Africa Sub-Saharan Africa (excluding high income)Sub-Saharan Africa (IDA & IBRD countries)SudanSurinameSwazilandSwedenSwitzerlandSyrian Arab RepublicTajikistanTanzaniaThailandTimor-LesteTogoTongaTrinidad and TobagoTunisiaTurkeyTuvaluUgandaUkraineUnited KingdomUnited StatesUpper middle incomeUruguayVanuatuVenezuela, RBWest Bank and GazaWorldYemen, Rep.ZambiaZimbabwe Timeline:
This timeline shows a graph from 1961 to 2016 of Israel. No data until 1960. Number of actual observations by date: 53.
Source name:
World Development Indicators
Source organization:
International Monetary Fund, Balance of Payments Statistics Yearbook and data files.
Categories, topics:
Private Sector, Trade
Last updated:
apr 23, 2017
Indicators value changes by year
Minimum:
10.891
jan 1, 1961
Maximum:
37.233
jan 1, 1982
At the date of observation
Value
Absolute change
Change from previous value
jan 1, 1961
10.891
+10.891
0.0%
jan 1, 1962
14.173
+3.282
30.14%
jan 1, 1966
17.742
+3.569
25.18%
jan 1, 1967
18.702
+0.96
5.41%
jan 1, 1968
23.333
+4.631
24.76%
jan 1, 1969
25.0
+1.667
7.14%
jan 1, 1970
24.432
-0.568
-2.27%
jan 1, 1971
20.05
-4.382
-17.93%
jan 1, 1972
20.455
+0.404
2.02%
jan 1, 1973
29.706
+9.252
45.23%
jan 1, 1974
33.248
+3.542
11.92%
jan 1, 1975
34.04
+0.792
2.38%
jan 1, 1976
33.394
-0.646
-1.9%
jan 1, 1977
29.782
-3.612
-10.82%
jan 1, 1978
30.267
+0.485
1.63%
jan 1, 1979
30.641
+0.374
1.23%
jan 1, 1980
35.34
+4.7
15.34%
jan 1, 1981
37.055
+1.715
4.85%
jan 1, 1982
37.233
+0.177
0.48%
jan 1, 1983
26.698
-10.535
-28.3%
jan 1, 1984
29.426
+2.729
10.22%
jan 1, 1985
26.521
-2.906
-9.87%
jan 1, 1986
22.993
-3.528
-13.3%
jan 1, 1987
28.722
+5.729
24.91%
jan 1, 1988
29.268
+0.546
1.9%
jan 1, 1989
28.891
-0.377
-1.29%
jan 1, 1990
30.085
+1.194
4.13%
jan 1, 1991
29.693
-0.392
-1.3%
jan 1, 1992
28.71
-0.983
-3.31%
jan 1, 1993
26.577
-2.133
-7.43%
jan 1, 1994
28.21
+1.632
6.14%
jan 1, 1995
28.803
+0.594
2.1%
jan 1, 1996
26.067
-2.737
-9.5%
jan 1, 1997
26.162
+0.095
0.37%
jan 1, 1998
25.871
-0.291
-1.11%
jan 1, 1999
27.304
+1.433
5.54%
jan 1, 2000
25.535
-1.768
-6.48%
jan 1, 2001
23.66
-1.876
-7.35%
jan 1, 2002
25.153
+1.494
6.31%
jan 1, 2003
23.909
-1.244
-4.95%
jan 1, 2004
23.226
-0.684
-2.86%
jan 1, 2005
21.201
-2.025
-8.72%
jan 1, 2006
21.273
+0.073
0.34%
jan 1, 2007
21.514
+0.241
1.13%
jan 1, 2008
21.061
-0.453
-2.11%
jan 1, 2009
18.827
-2.234
-10.61%
jan 1, 2010
19.107
+0.28
1.49%
jan 1, 2011
20.145
+1.038
5.43%
jan 1, 2012
19.187
-0.958
-4.75%
jan 1, 2013
17.179
-2.008
-10.47%
jan 1, 2014
18.896
+1.717
9.99%
jan 1, 2015
18.609
-0.287
-1.52%
jan 1, 2016
21.314
+2.705
14.53%
Ranking of countries by current statistics by years


Comments: