Download This statistics in other country:
Timeline:
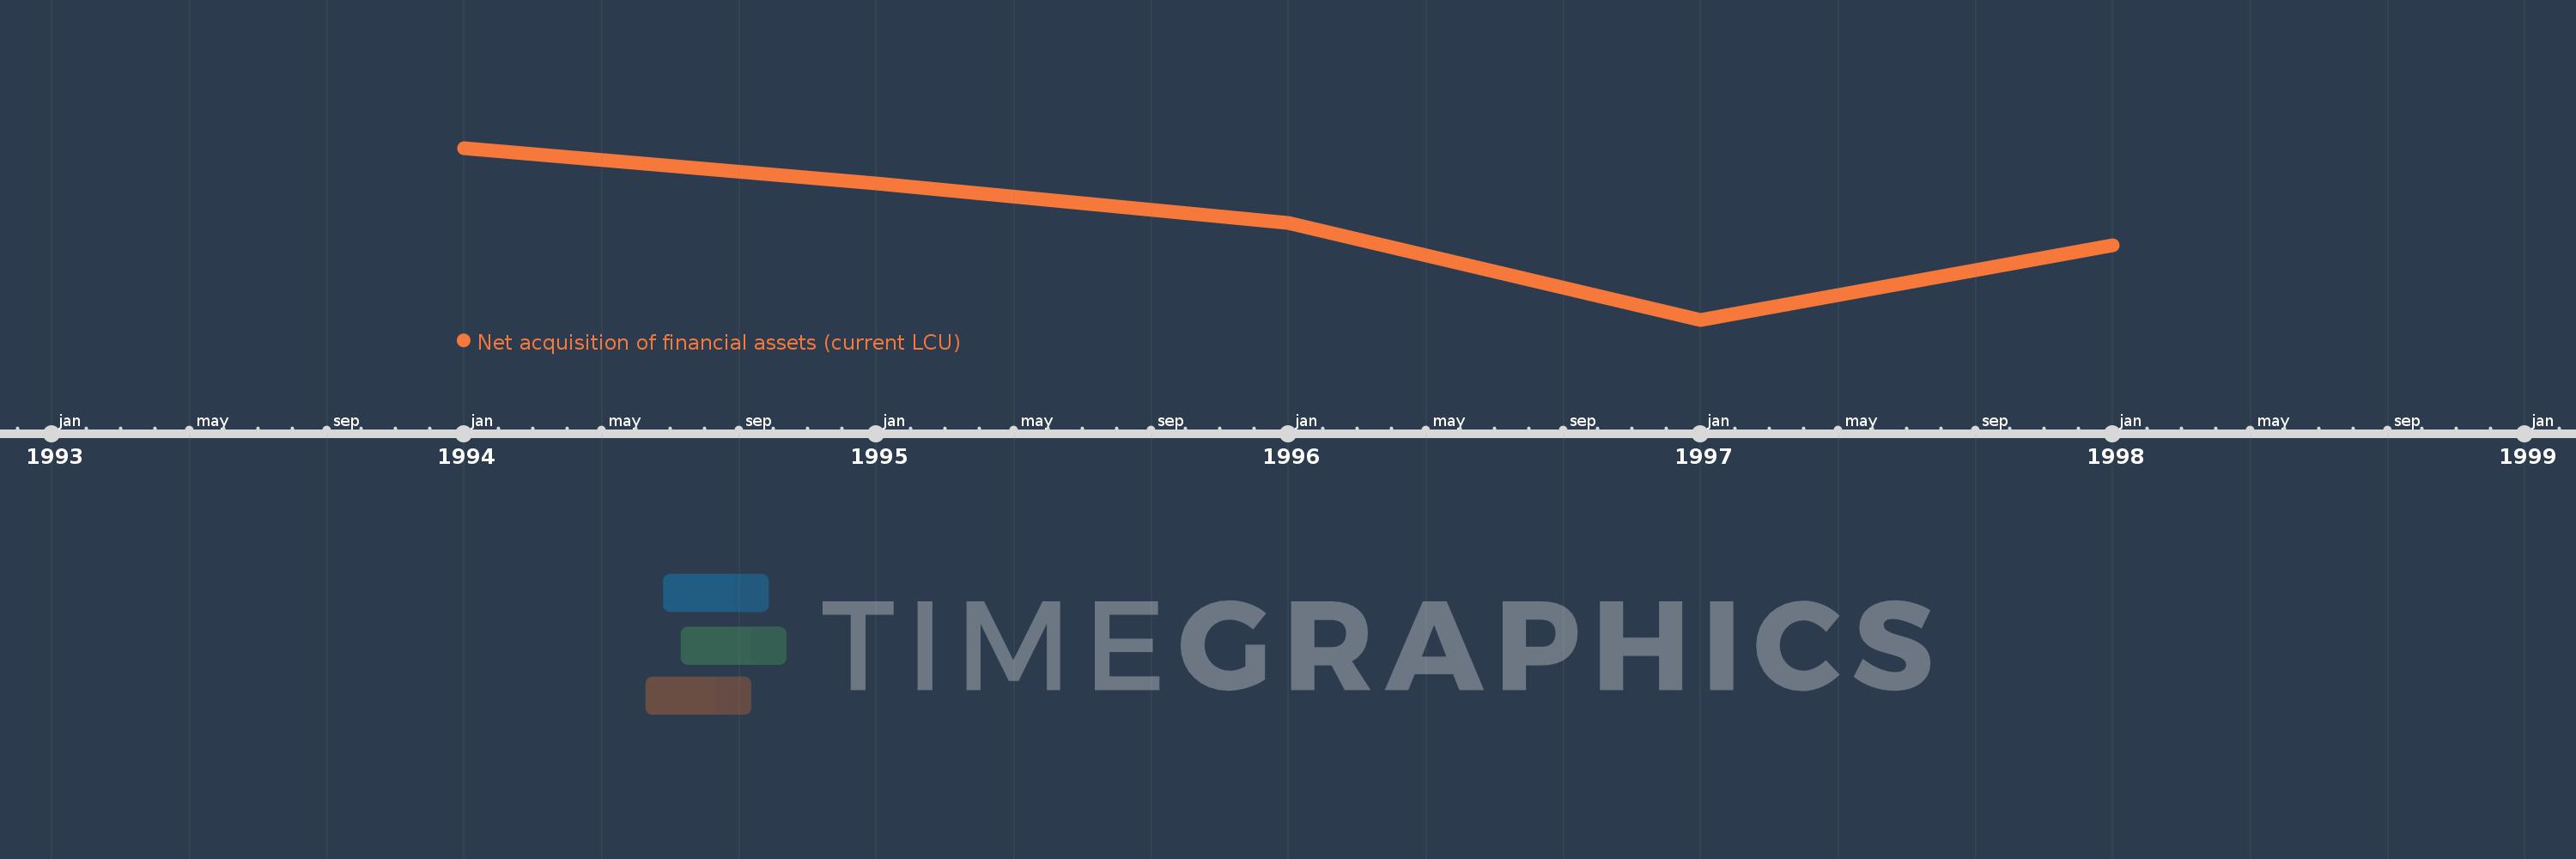
This timeline shows a graph from 1994 to 1998 of Zimbabwe. No data until 1993. Number of actual observations by date: 5.
Source name:
World Development Indicators
Source organization:
International Monetary Fund, Government Finance Statistics Yearbook and data files.
Categories, topics:
Public Sector
Last updated:
apr 23, 2017
Indicators value changes by year
Minimum:
-921.959 mln
jan 1, 1997
Maximum:
59.348 mln
jan 1, 1994
At the date of observation
Value
Absolute change
Change from the previous value
jan 1, 1994
59.348 mln
+59.348 mln
0.0%
jan 1, 1995
-141.656 mln
-201.004 mln
-338.69%
jan 1, 1996
-368.096 mln
-226.44 mln
159.85%
jan 1, 1997
-921.959 mln
-553.863 mln
150.47%
jan 1, 1998
-496.428 mln
+425.531 mln
-46.16%
Ranking of countries by current statistics by years
