29
/
en
AIzaSyAYiBZKx7MnpbEhh9jyipgxe19OcubqV5w
April 1, 2024
68039
Angola
AGO
true
2
1
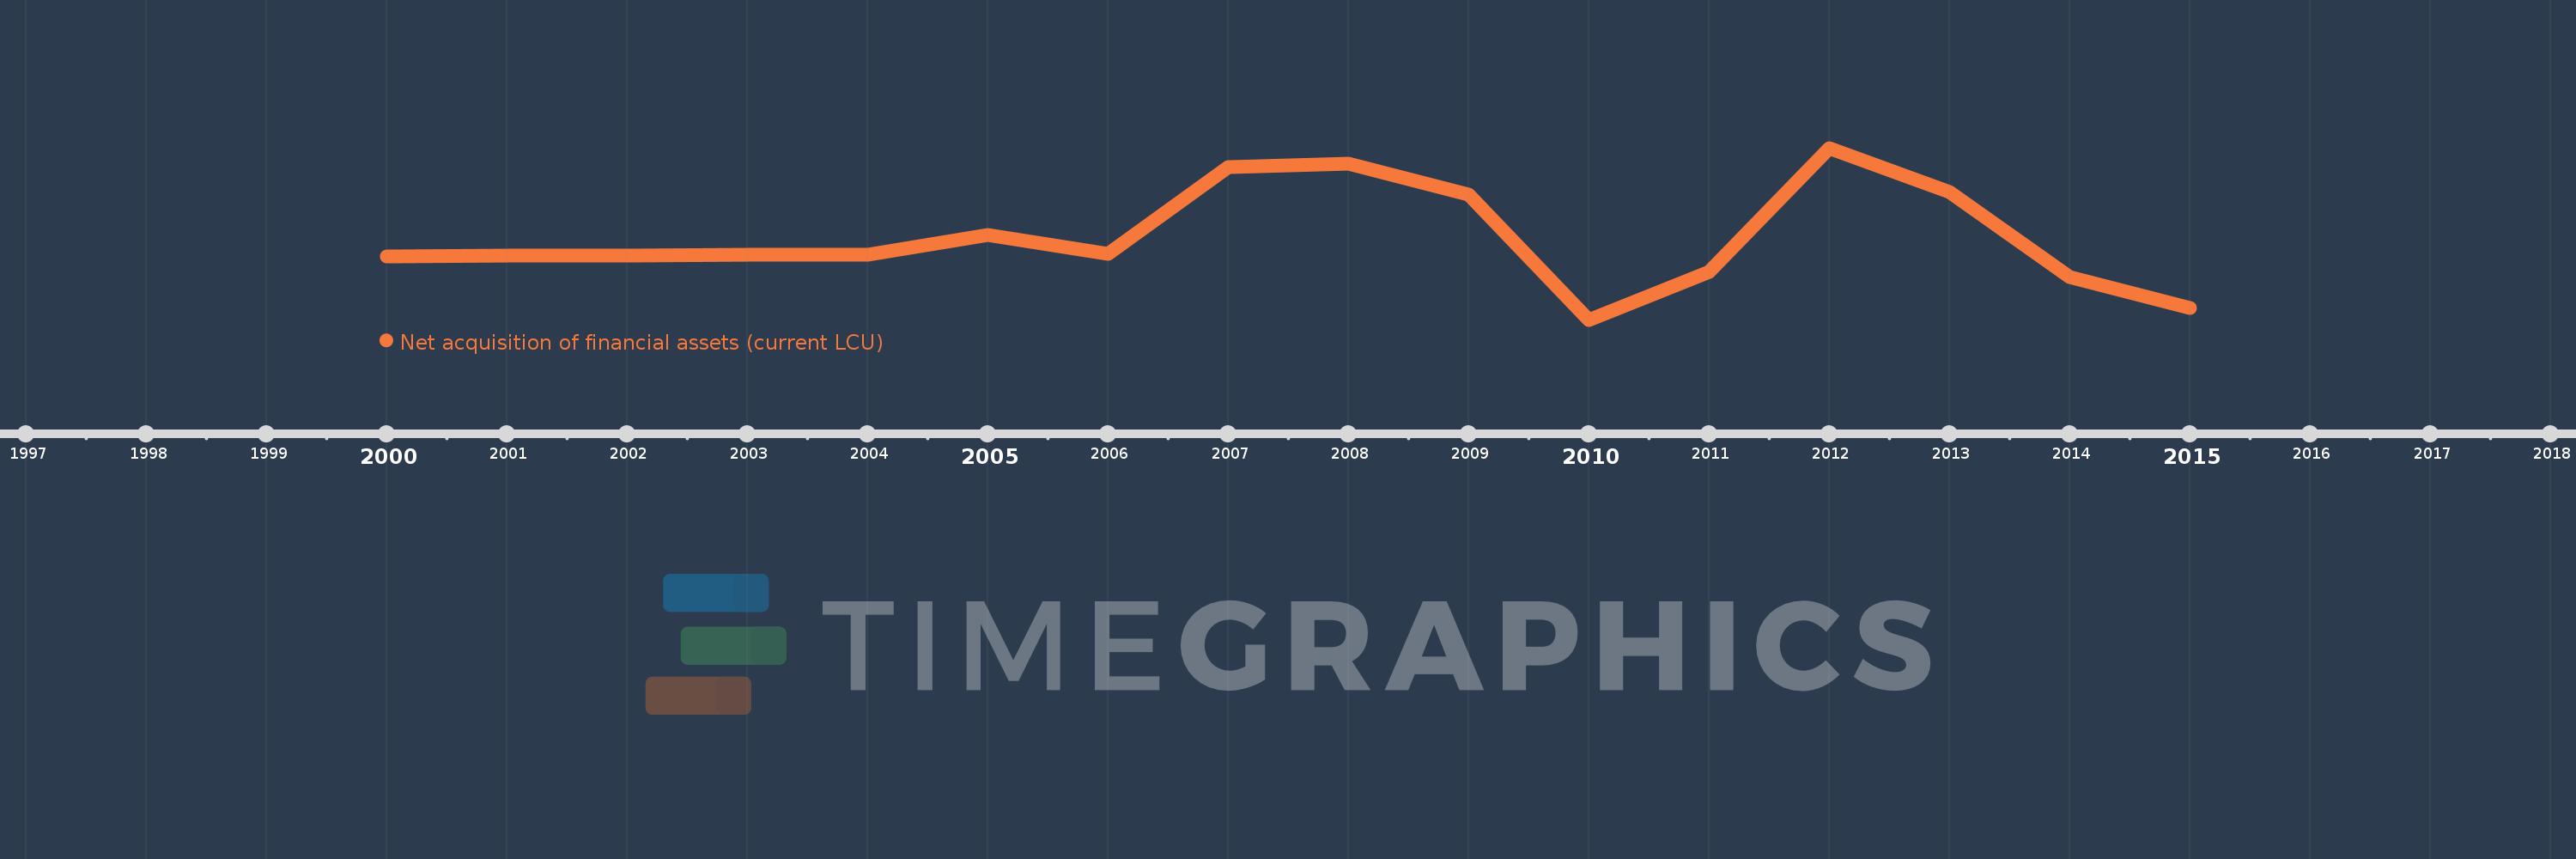
Net acquisition of financial assets (current LCU)
2015,2014,2013,2012,2011,2010,2009,2008,2007,2006,2005,2004,2003,2002,2001,2000
This statistics in other country:
Timeline:
This timeline shows a graph from 2000 to 2015 of Angola. No data until 1999. Number of actual observations by date: 16.
Source name:
World Development Indicators
Source organization:
International Monetary Fund, Government Finance Statistics Yearbook and data files.
Categories, topics:
Public Sector
Last updated:
apr 23, 2017
Indicators value changes by year
Minimum:
-551.234 bln
jan 1, 2010
Maximum:
943.834 bln
jan 1, 2012
At the date of observation
Value
Absolute change
Change from previous value
jan 1, 2000
576.193 mln
+576.193 mln
0.0%
jan 1, 2001
9.896 bln
+9.32 bln
1.62K%
jan 1, 2002
4.941 bln
-4.954 bln
-50.07%
jan 1, 2003
17.925 bln
+12.984 bln
262.77%
jan 1, 2004
11.375 bln
-6.551 bln
-36.54%
jan 1, 2005
187.329 bln
+175.954 bln
1.55K%
jan 1, 2006
25.014 bln
-162.315 bln
-86.65%
jan 1, 2007
774.424 bln
+749.41 bln
3.0K%
jan 1, 2008
809.06 bln
+34.636 bln
4.47%
jan 1, 2009
535.215 bln
-273.845 bln
-33.85%
jan 1, 2010
-551.234 bln
-1.086 trl
-202.99%
jan 1, 2011
-131.194 bln
+420.04 bln
-76.2%
jan 1, 2012
943.834 bln
+1.075 trl
-819.42%
jan 1, 2013
561.351 bln
-382.483 bln
-40.52%
jan 1, 2014
-179.184 bln
-740.535 bln
-131.92%
jan 1, 2015
-447.365 bln
-268.181 bln
149.67%
Ranking of countries by current statistics by years


Comments: