29
/
en
AIzaSyAYiBZKx7MnpbEhh9jyipgxe19OcubqV5w
April 1, 2024
231366
Rwanda
RWA
true
2
1
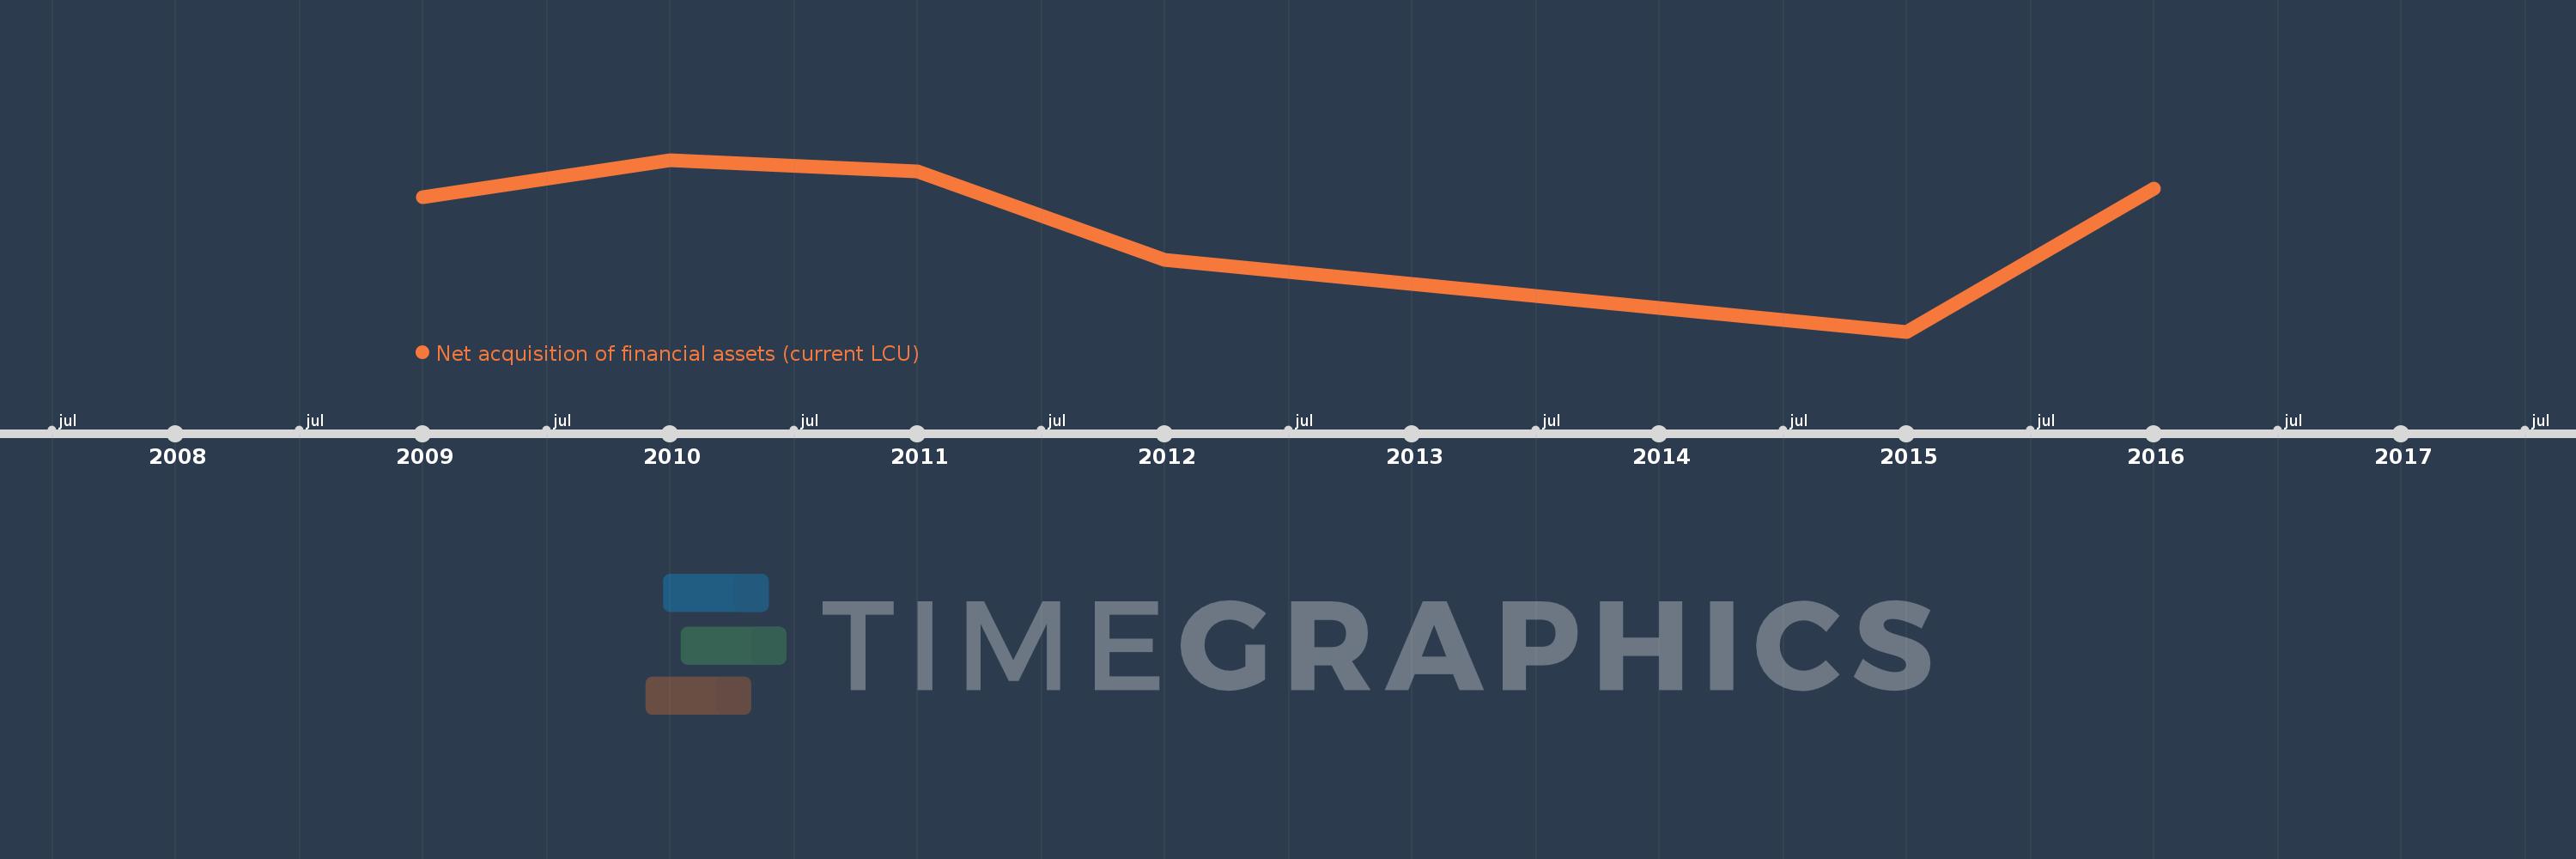
Net acquisition of financial assets (current LCU)
2016,2015,2012,2011,2010,2009
This statistics in other country:
Timeline:
This timeline shows a graph from 2009 to 2016 of Rwanda. No data until 2008. Number of actual observations by date: 6.
Source name:
World Development Indicators
Source organization:
International Monetary Fund, Government Finance Statistics Yearbook and data files.
Categories, topics:
Public Sector
Last updated:
apr 23, 2017
Indicators value changes by year
Minimum:
-62.869 bln
jan 1, 2015
Maximum:
34.683 bln
jan 1, 2010
At the date of observation
Value
Absolute change
Change from previous value
jan 1, 2009
13.488 bln
+13.488 bln
0.0%
jan 1, 2010
34.683 bln
+21.194 bln
157.13%
jan 1, 2011
28.306 bln
-6.377 bln
-18.39%
jan 1, 2012
-22.251 bln
-50.557 bln
-178.61%
jan 1, 2015
-62.869 bln
-40.618 bln
182.55%
jan 1, 2016
18.294 bln
+81.164 bln
-129.1%
Ranking of countries by current statistics by years


Comments: