29
/
en
AIzaSyAYiBZKx7MnpbEhh9jyipgxe19OcubqV5w
April 1, 2024
221168
Paraguay
PRY
true
2
1
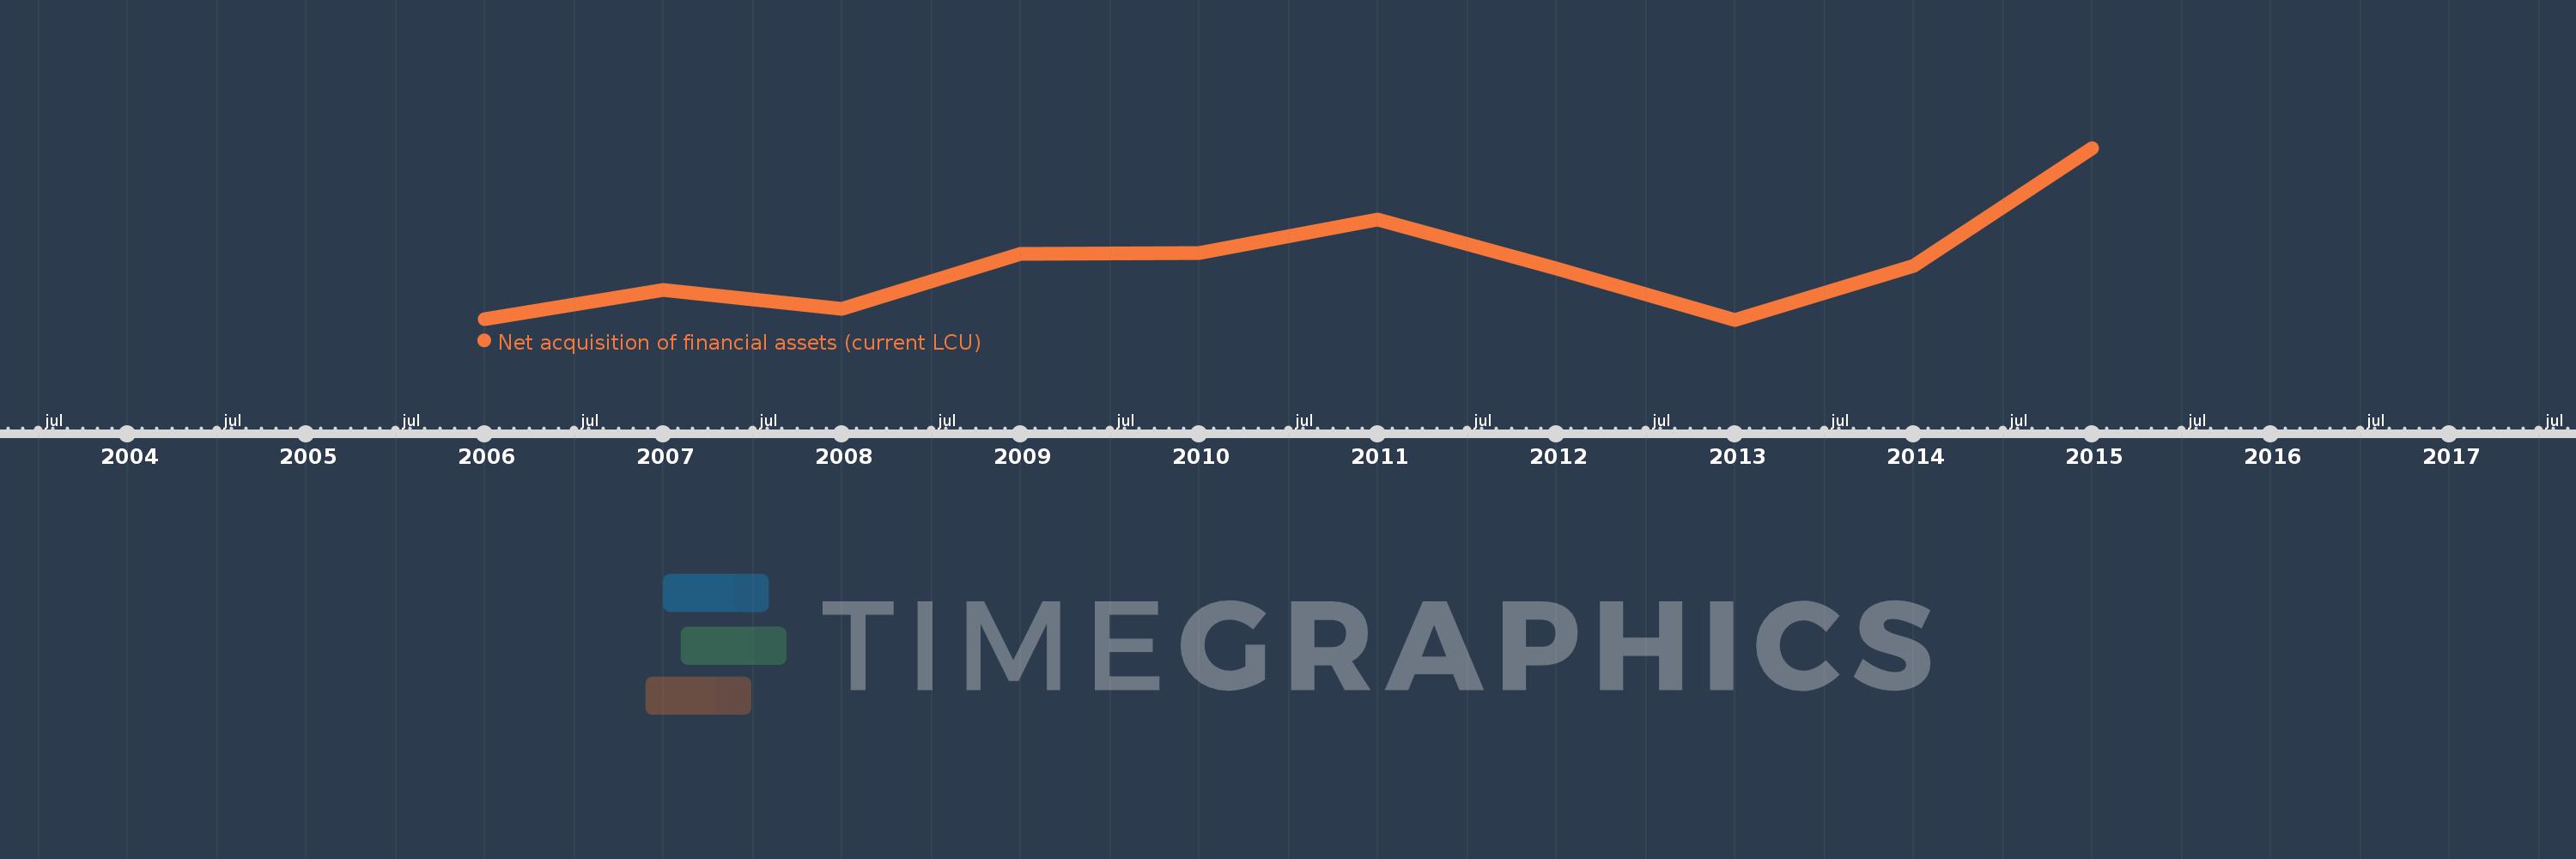
Net acquisition of financial assets (current LCU)
2015,2014,2013,2012,2011,2010,2009,2008,2007,2006
This statistics in other country:
Timeline:
This timeline shows a graph from 2006 to 2015 of Paraguay. No data until 2005. Number of actual observations by date: 10.
Source name:
World Development Indicators
Source organization:
International Monetary Fund, Government Finance Statistics Yearbook and data files.
Categories, topics:
Public Sector
Last updated:
apr 23, 2017
Indicators value changes by year
Minimum:
87.28 bln
jan 1, 2013
Maximum:
3.98 trl
jan 1, 2015
At the date of observation
Value
Absolute change
Change from previous value
jan 1, 2006
105.4 bln
+105.4 bln
0.0%
jan 1, 2007
755.3 bln
+649.9 bln
616.6%
jan 1, 2008
330.8 bln
-424.5 bln
-56.2%
jan 1, 2009
1.574 trl
+1.243 trl
375.7%
jan 1, 2010
1.603 trl
+29.041 bln
1.85%
jan 1, 2011
2.354 trl
+751.331 bln
46.88%
jan 1, 2012
1.256 trl
-1.098 trl
-46.65%
jan 1, 2013
87.28 bln
-1.169 trl
-93.05%
jan 1, 2014
1.316 trl
+1.229 trl
1.41K%
jan 1, 2015
3.98 trl
+2.664 trl
202.38%
Ranking of countries by current statistics by years


Comments: