29
/
en
AIzaSyAYiBZKx7MnpbEhh9jyipgxe19OcubqV5w
April 1, 2024
73260
Australia
AUS
true
2
1
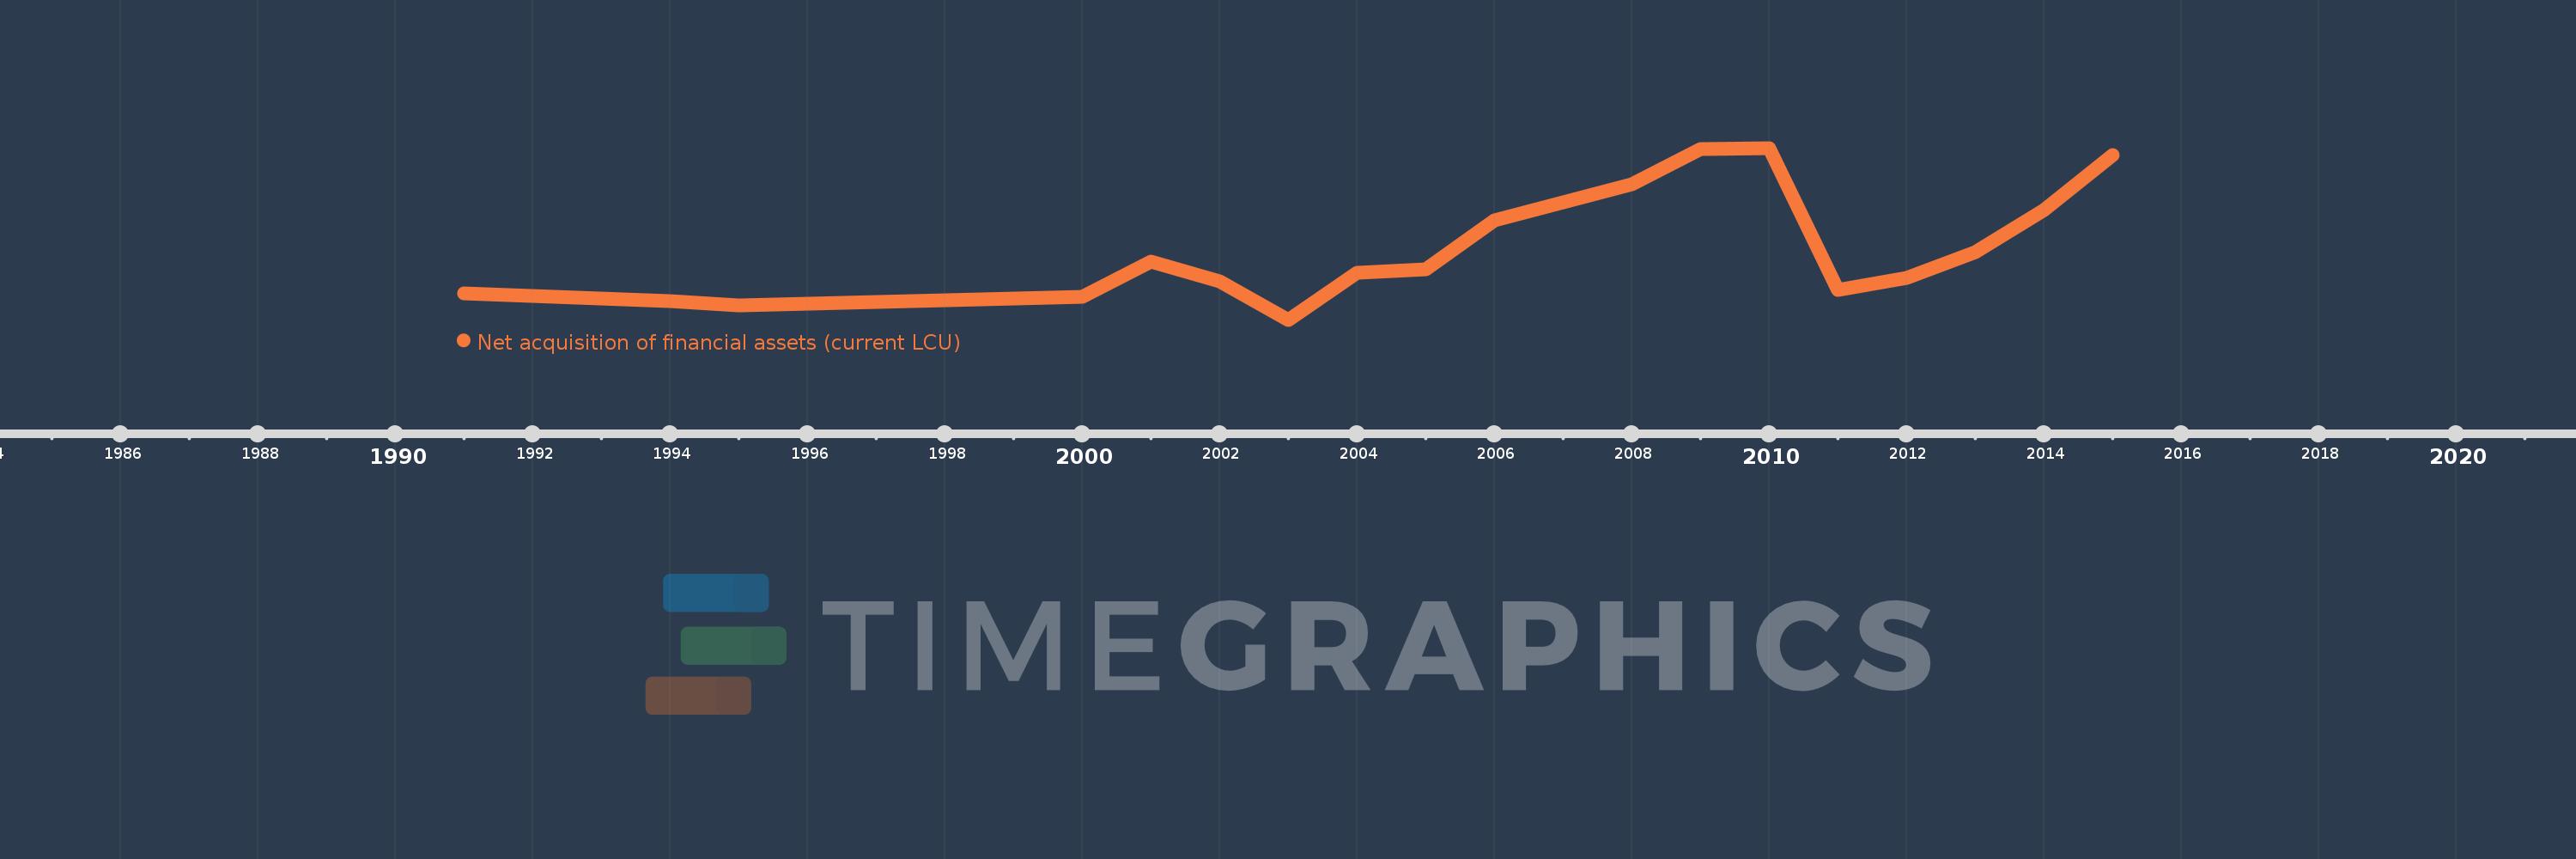
Net acquisition of financial assets (current LCU)
2015,2014,2013,2012,2011,2010,2009,2008,2007,2006,2005,2004,2003,2002,2001,2000,1995,1994,1993,1992,1991
This statistics in other country:
Timeline:
This timeline shows a graph from 1991 to 2015 of Australia. No data until 1990. Number of actual observations by date: 21.
Source name:
World Development Indicators
Source organization:
International Monetary Fund, Government Finance Statistics Yearbook and data files.
Categories, topics:
Public Sector
Last updated:
apr 23, 2017
Indicators value changes by year
Minimum:
-6.022 bln
jan 1, 2003
Maximum:
25.67 bln
jan 1, 2010
At the date of observation
Value
Absolute change
Change from previous value
jan 1, 1991
-1.221 bln
-1.221 bln
0.0%
jan 1, 1992
-1.559 bln
-338.0 mln
27.68%
jan 1, 1993
-2.06 bln
-501.0 mln
32.14%
jan 1, 1994
-2.535 bln
-475.0 mln
23.06%
jan 1, 1995
-3.365 bln
-830.0 mln
32.74%
jan 1, 2000
-1.766 bln
+1.599 bln
-47.52%
jan 1, 2001
4.712 bln
+6.478 bln
-366.82%
jan 1, 2002
1.092 bln
-3.62 bln
-76.83%
jan 1, 2003
-6.022 bln
-7.114 bln
-651.47%
jan 1, 2004
2.592 bln
+8.614 bln
-143.04%
jan 1, 2005
3.258 bln
+666.0 mln
25.69%
jan 1, 2006
12.361 bln
+9.103 bln
279.4%
jan 1, 2007
15.701 bln
+3.34 bln
27.02%
jan 1, 2008
18.977 bln
+3.276 bln
20.86%
jan 1, 2009
25.499 bln
+6.522 bln
34.37%
jan 1, 2010
25.67 bln
+171.0 mln
0.67%
jan 1, 2011
-563.0 mln
-26.233 bln
-102.19%
jan 1, 2012
1.665 bln
+2.228 bln
-395.74%
jan 1, 2013
6.382 bln
+4.717 bln
283.3%
jan 1, 2014
14.253 bln
+7.871 bln
123.33%
jan 1, 2015
24.283 bln
+10.03 bln
70.37%
Ranking of countries by current statistics by years


Comments: