Download This statistics in other country:
Timeline:
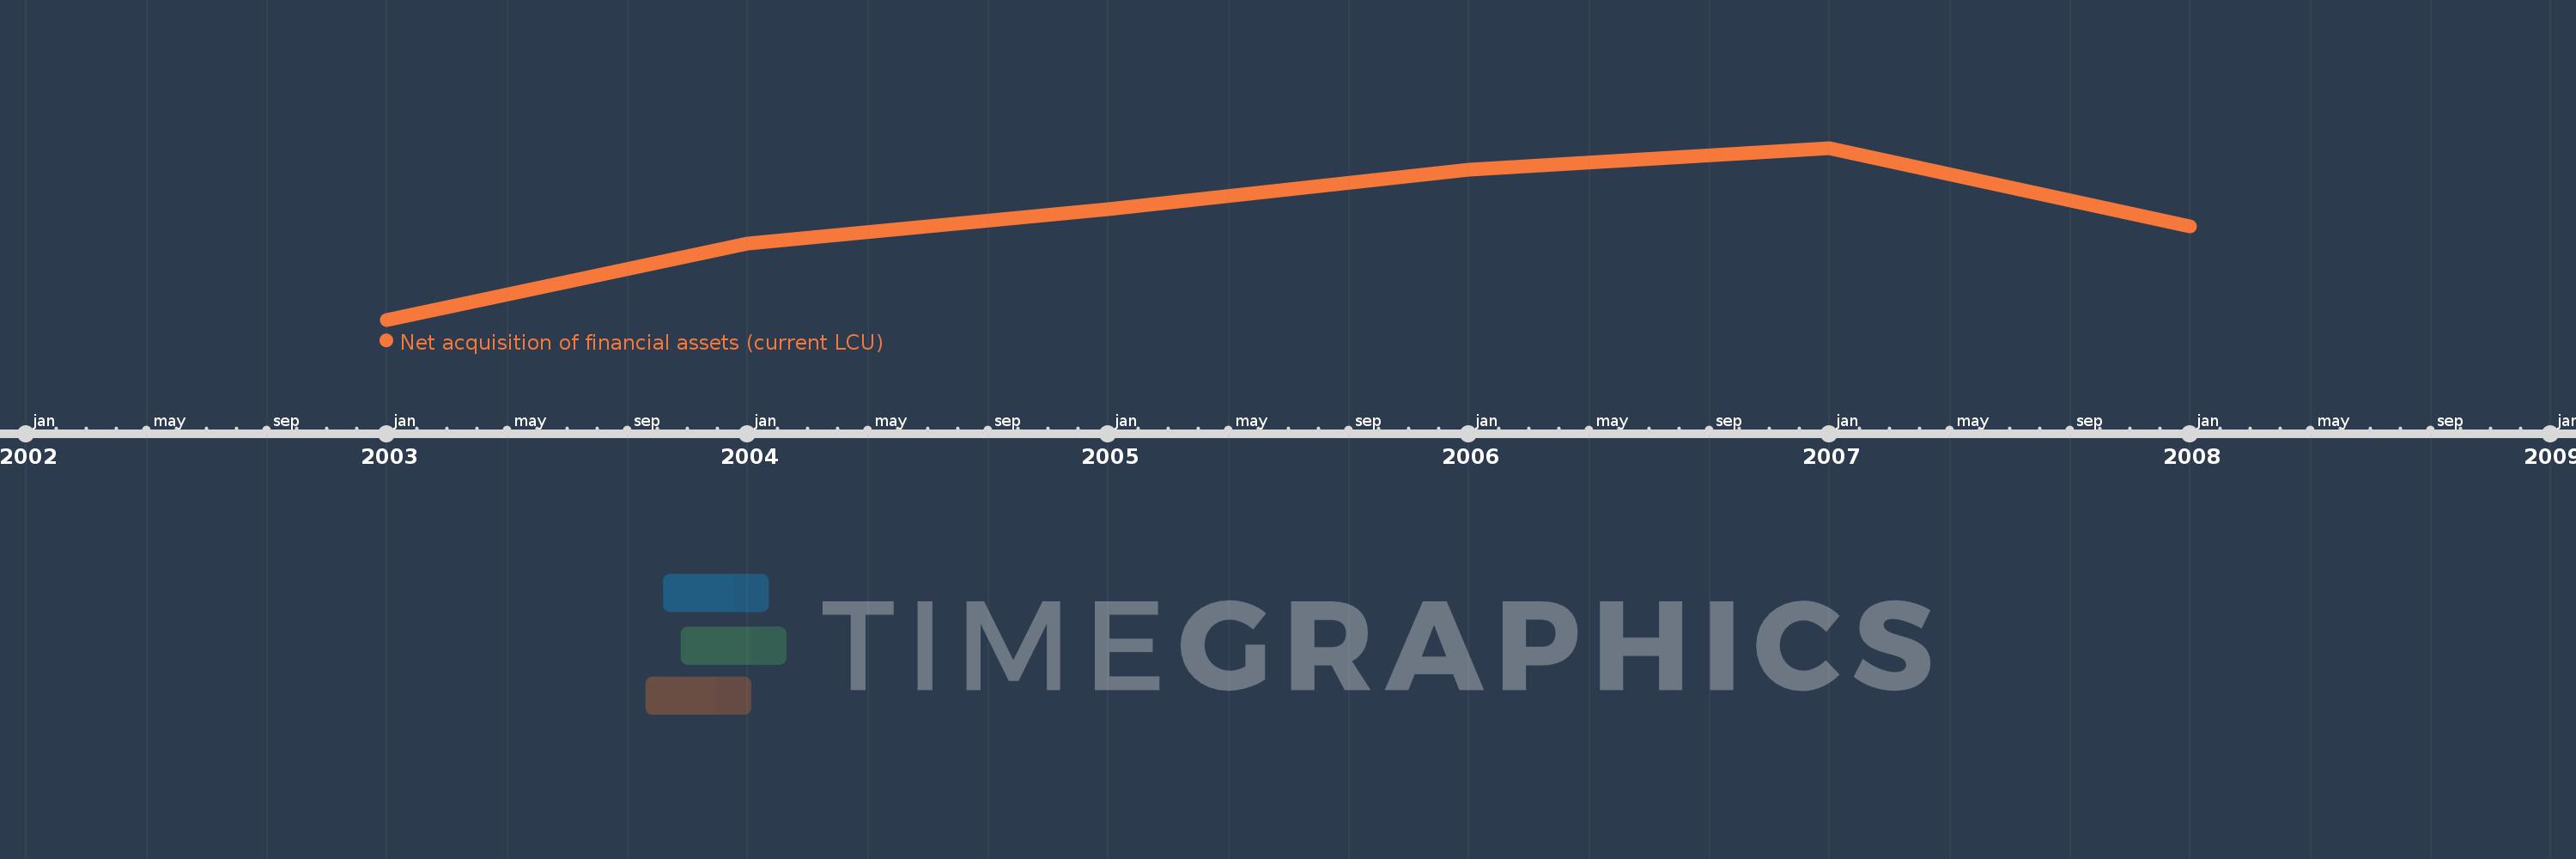
This timeline shows a graph from 2003 to 2008 of San Marino. No data until 2002. Number of actual observations by date: 6.
Source name:
World Development Indicators
Source organization:
International Monetary Fund, Government Finance Statistics Yearbook and data files.
Categories, topics:
Public Sector
Last updated:
apr 23, 2017
Indicators value changes by year
Minimum:
-7.227 mln
jan 1, 2003
Maximum:
236.034 mln
jan 1, 2007
At the date of observation
Value
Absolute change
Change from the previous value
jan 1, 2003
-7.227 mln
-7.227 mln
0.0%
jan 1, 2004
100.74 mln
+107.967 mln
-1.49K%
jan 1, 2005
149.123 mln
+48.383 mln
48.03%
jan 1, 2006
205.4 mln
+56.277 mln
37.74%
jan 1, 2007
236.034 mln
+30.634 mln
14.91%
jan 1, 2008
124.443 mln
-111.591 mln
-47.28%
Ranking of countries by current statistics by years
