Download This statistics in other country:
Timeline:
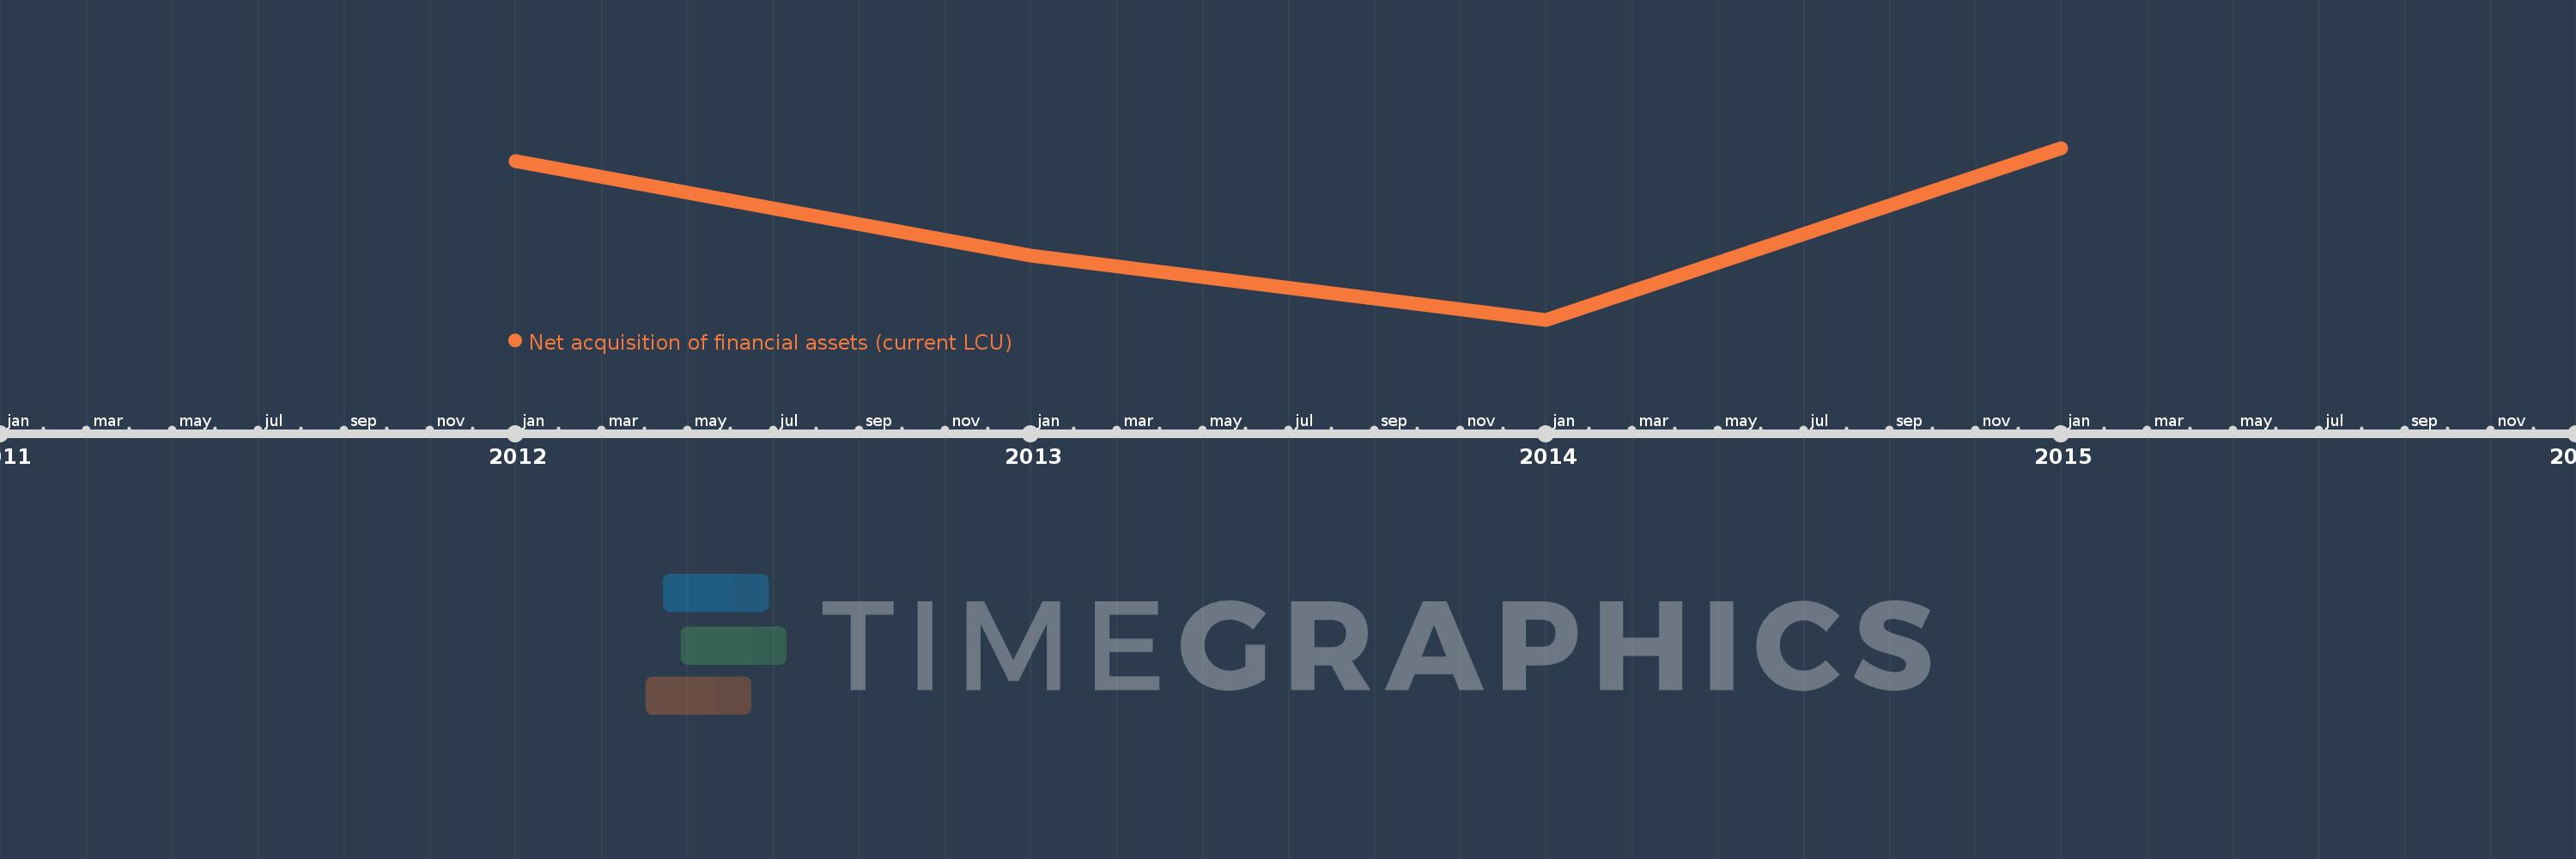
This timeline shows a graph from 2012 to 2015 of United Arab Emirates. No data until 2011. Number of actual observations by date: 4.
Source name:
World Development Indicators
Source organization:
International Monetary Fund, Government Finance Statistics Yearbook and data files.
Categories, topics:
Public Sector
Last updated:
apr 23, 2017
Indicators value changes by year
Minimum:
-28.131 bln
jan 1, 2014
Maximum:
-1.235 bln
jan 1, 2015
At the date of observation
Value
Absolute change
Change from the previous value
jan 1, 2012
-3.288 bln
-3.288 bln
0.0%
jan 1, 2013
-18.114 bln
-14.826 bln
450.9%
jan 1, 2014
-28.131 bln
-10.017 bln
55.3%
jan 1, 2015
-1.235 bln
+26.895 bln
-95.61%
Ranking of countries by current statistics by years
