29
/
en
AIzaSyAYiBZKx7MnpbEhh9jyipgxe19OcubqV5w
April 1, 2024
258624
Syrian Arab Republic
SYR
true
2
1
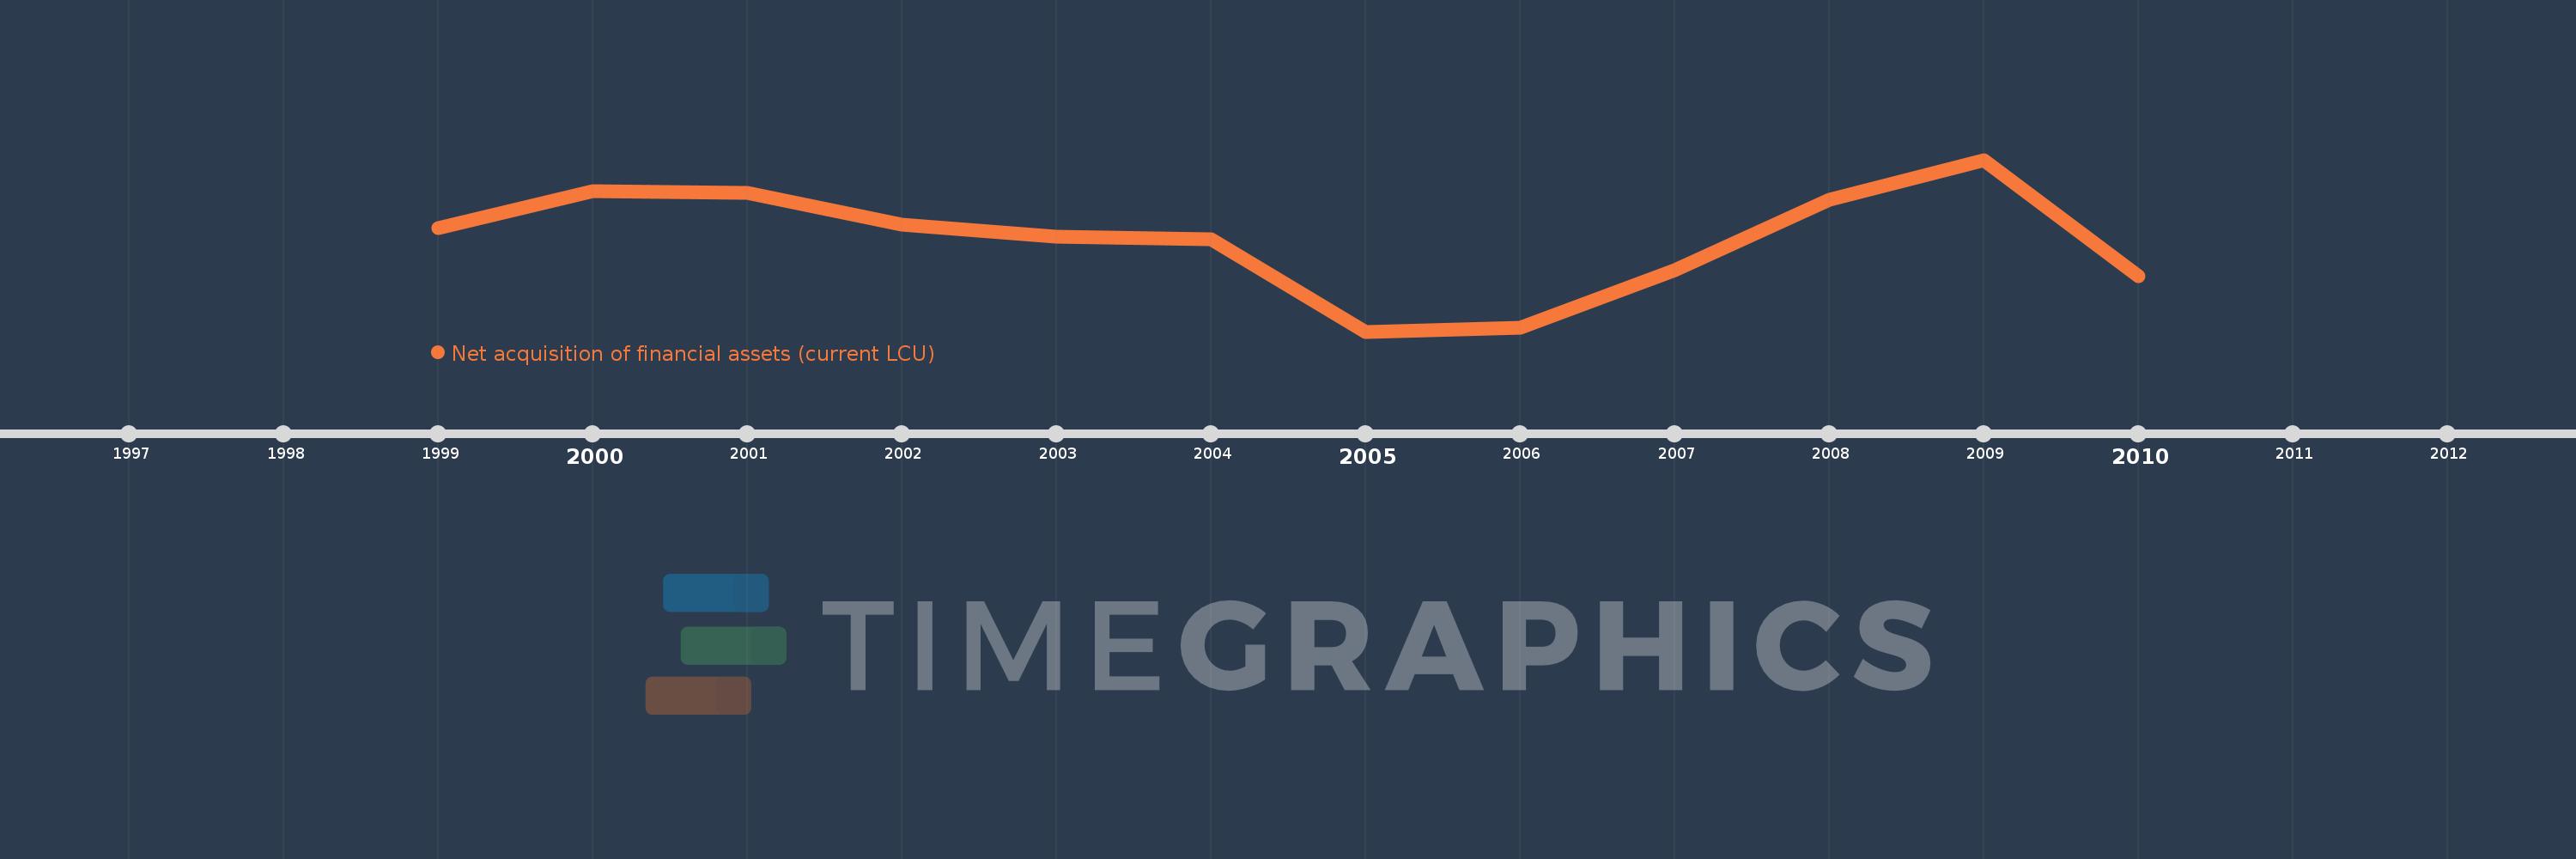
Net acquisition of financial assets (current LCU)
2010,2009,2008,2007,2006,2005,2004,2003,2002,2001,2000,1999
This statistics in other country:
Timeline:
This timeline shows a graph from 1999 to 2010 of Syrian Arab Republic. No data until 1998. Number of actual observations by date: 12.
Source name:
World Development Indicators
Source organization:
International Monetary Fund, Government Finance Statistics Yearbook and data files.
Categories, topics:
Public Sector
Last updated:
apr 23, 2017
Indicators value changes by year
Minimum:
-59.729 bln
jan 1, 2005
Maximum:
67.481 bln
jan 1, 2009
At the date of observation
Value
Absolute change
Change from previous value
jan 1, 1999
17.071 bln
+17.071 bln
0.0%
jan 1, 2000
44.265 bln
+27.194 bln
159.3%
jan 1, 2001
42.943 bln
-1.322 bln
-2.99%
jan 1, 2002
19.409 bln
-23.534 bln
-54.8%
jan 1, 2003
10.527 bln
-8.882 bln
-45.76%
jan 1, 2004
8.518 bln
-2.009 bln
-19.08%
jan 1, 2005
-59.729 bln
-68.247 bln
-801.21%
jan 1, 2006
-56.879 bln
+2.85 bln
-4.77%
jan 1, 2007
-14.437 bln
+42.442 bln
-74.62%
jan 1, 2008
37.636 bln
+52.073 bln
-360.69%
jan 1, 2009
67.481 bln
+29.845 bln
79.3%
jan 1, 2010
-18.736 bln
-86.217 bln
-127.76%
Ranking of countries by current statistics by years


Comments: