29
/
en
AIzaSyAYiBZKx7MnpbEhh9jyipgxe19OcubqV5w
April 1, 2024
254390
Suriname
SUR
true
2
1
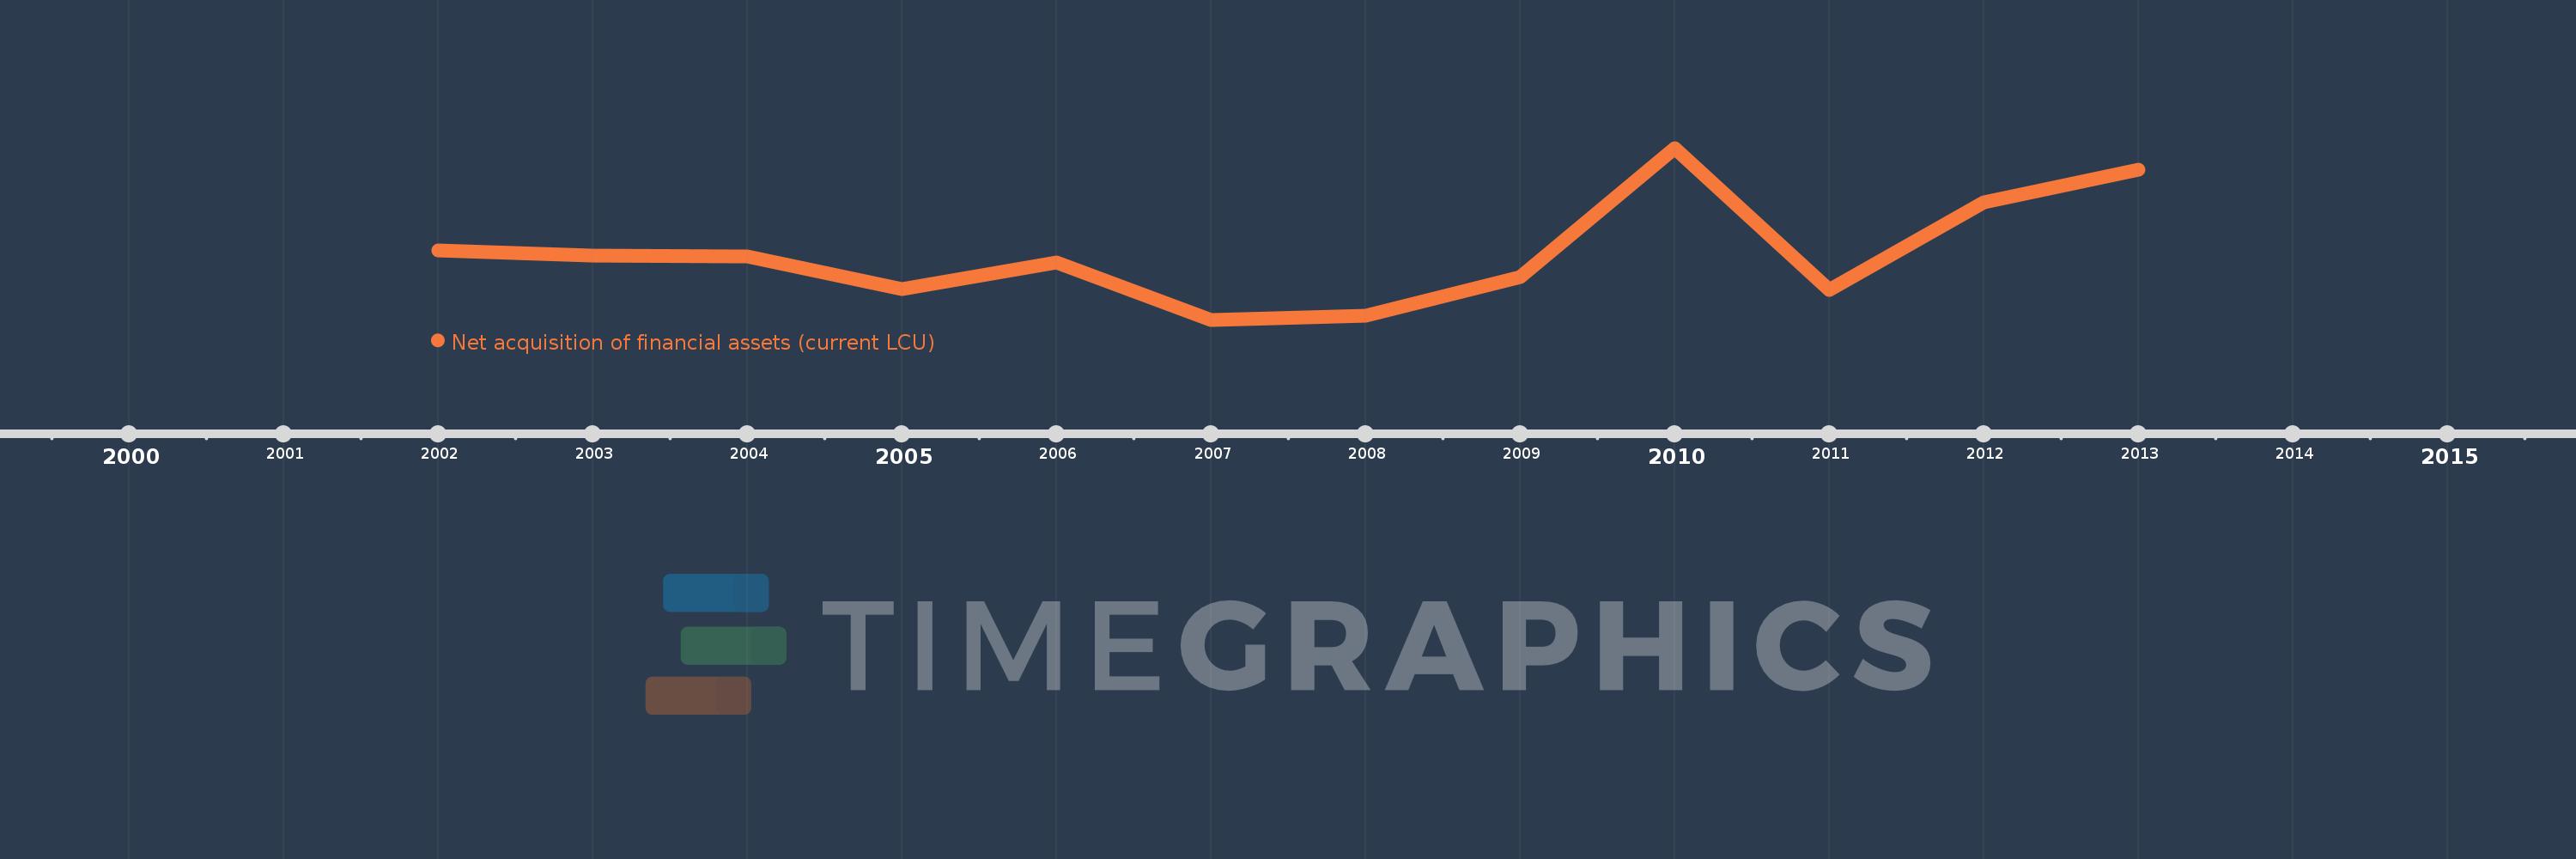
Net acquisition of financial assets (current LCU)
2013,2012,2011,2010,2009,2008,2007,2006,2005,2004,2003,2002
This statistics in other country:
Timeline:
This timeline shows a graph from 2002 to 2013 of Suriname. No data until 2001. Number of actual observations by date: 12.
Source name:
World Development Indicators
Source organization:
International Monetary Fund, Government Finance Statistics Yearbook and data files.
Categories, topics:
Public Sector
Last updated:
apr 23, 2017
Indicators value changes by year
Minimum:
-119.625 mln
jan 1, 2007
Maximum:
306.107 mln
jan 1, 2010
At the date of observation
Value
Absolute change
Change from previous value
jan 1, 2002
51.9 mln
+51.9 mln
0.0%
jan 1, 2003
39.1 mln
-12.8 mln
-24.66%
jan 1, 2004
36.4 mln
-2.7 mln
-6.91%
jan 1, 2005
-43.5 mln
-79.9 mln
-219.51%
jan 1, 2006
21.469 mln
+64.969 mln
-149.35%
jan 1, 2007
-119.625 mln
-141.094 mln
-657.19%
jan 1, 2008
-110.0 mln
+9.625 mln
-8.05%
jan 1, 2009
-14.697 mln
+95.303 mln
-86.64%
jan 1, 2010
306.107 mln
+320.804 mln
-2.18K%
jan 1, 2011
-46.27 mln
-352.378 mln
-115.12%
jan 1, 2012
170.851 mln
+217.121 mln
-469.24%
jan 1, 2013
251.298 mln
+80.447 mln
47.09%
Ranking of countries by current statistics by years


Comments: