29
/
en
AIzaSyAYiBZKx7MnpbEhh9jyipgxe19OcubqV5w
April 1, 2024
125131
Egypt, Arab Rep.
EGY
true
2
1
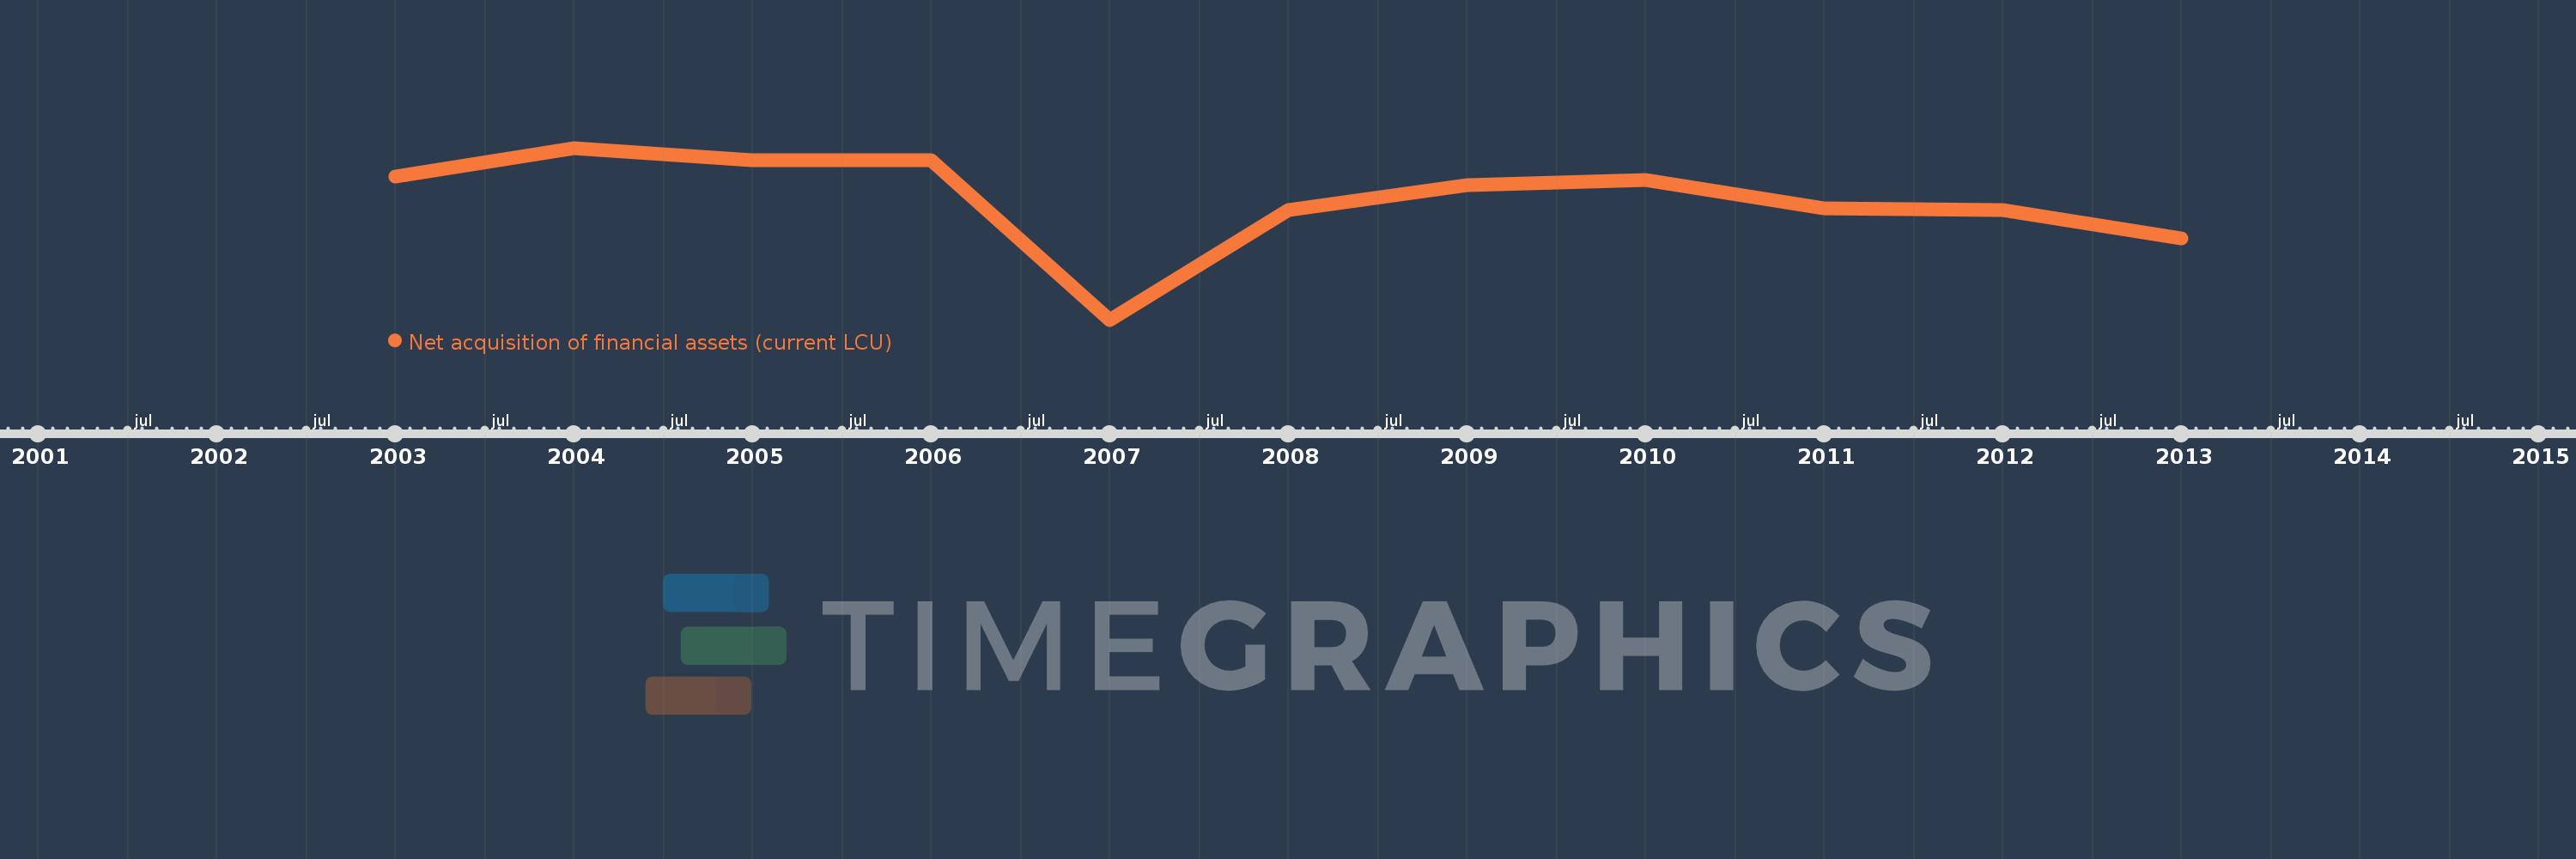
Net acquisition of financial assets (current LCU)
2013,2012,2011,2010,2009,2008,2007,2006,2005,2004,2003
This statistics in other country:
Timeline:
This timeline shows a graph from 2003 to 2013 of Egypt, Arab Rep.. No data until 2002. Number of actual observations by date: 11.
Source name:
World Development Indicators
Source organization:
International Monetary Fund, Government Finance Statistics Yearbook and data files.
Categories, topics:
Public Sector
Last updated:
apr 23, 2017
Indicators value changes by year
Minimum:
-27.641 bln
jan 1, 2007
Maximum:
46.169 bln
jan 1, 2004
At the date of observation
Value
Absolute change
Change from previous value
jan 1, 2003
33.946 bln
+33.946 bln
0.0%
jan 1, 2004
46.169 bln
+12.223 bln
36.01%
jan 1, 2005
40.839 bln
-5.33 bln
-11.54%
jan 1, 2006
40.867 bln
+28.0 mln
0.07%
jan 1, 2007
-27.641 bln
-68.508 bln
-167.64%
jan 1, 2008
19.573 bln
+47.214 bln
-170.81%
jan 1, 2009
30.107 bln
+10.534 bln
53.82%
jan 1, 2010
32.488 bln
+2.381 bln
7.91%
jan 1, 2011
20.284 bln
-12.204 bln
-37.56%
jan 1, 2012
19.363 bln
-921.0 mln
-4.54%
jan 1, 2013
7.395 bln
-11.968 bln
-61.81%
Ranking of countries by current statistics by years


Comments: