This statistics in other country:
Timeline:
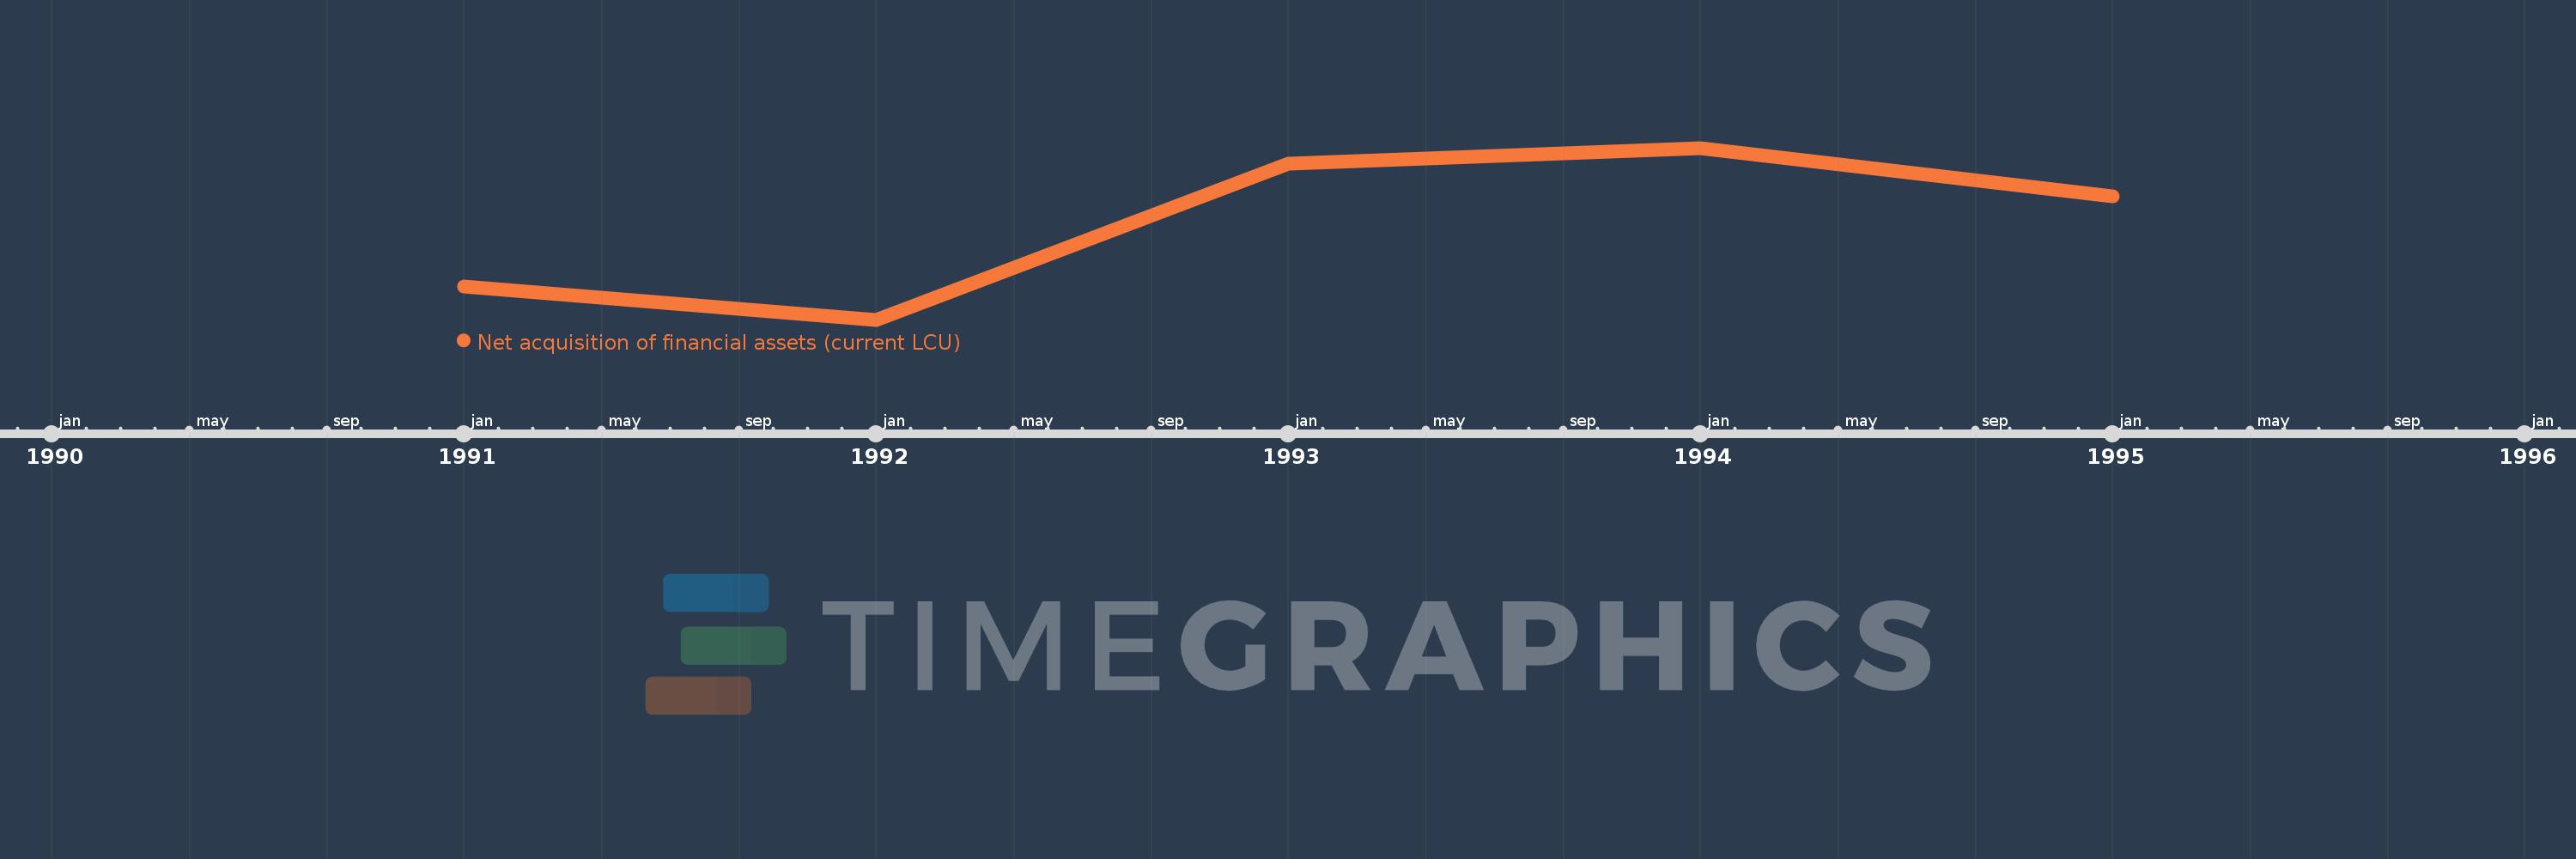
This timeline shows a graph from 1991 to 1995 of Finland. No data until 1990. Number of actual observations by date: 5.
Source name:
World Development Indicators
Source organization:
International Monetary Fund, Government Finance Statistics Yearbook and data files.
Categories, topics:
Public Sector
Last updated:
apr 23, 2017
Indicators value changes by year
Minimum:
89.14 mln
jan 1, 1992
Maximum:
5.456 bln
jan 1, 1994
At the date of observation
Value
Absolute change
Change from previous value
jan 1, 1991
1.114 bln
+1.114 bln
0.0%
jan 1, 1992
89.14 mln
-1.025 bln
-92.0%
jan 1, 1993
4.964 bln
+4.874 bln
5.47K%
jan 1, 1994
5.456 bln
+492.286 mln
9.92%
jan 1, 1995
3.957 bln
-1.499 bln
-27.47%
Ranking of countries by current statistics by years


Comments: