29
/
en
AIzaSyAYiBZKx7MnpbEhh9jyipgxe19OcubqV5w
April 1, 2024
126517
El Salvador
SLV
true
2
1
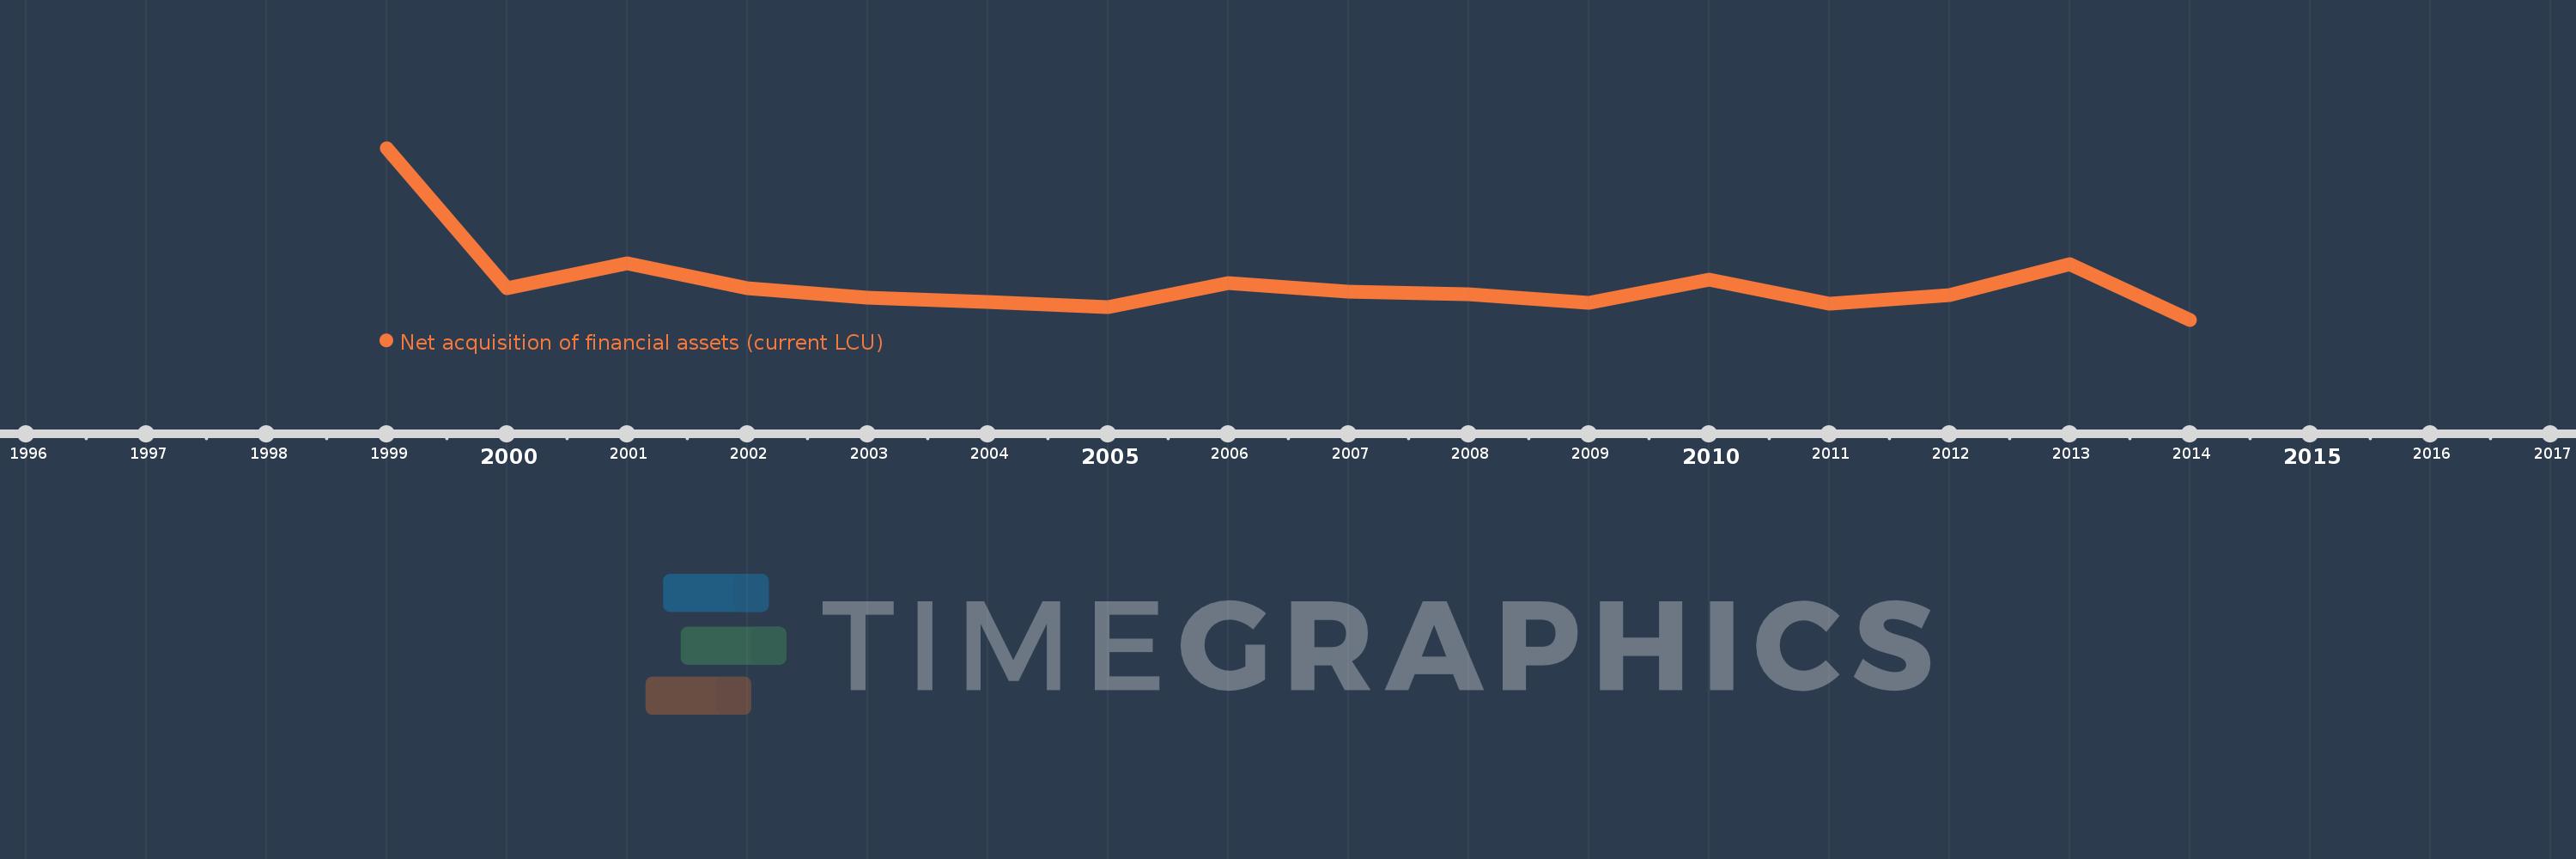
Net acquisition of financial assets (current LCU)
2014,2013,2012,2011,2010,2009,2008,2007,2006,2005,2004,2003,2002,2001,2000,1999
This statistics in other country:
Timeline:
This timeline shows a graph from 1999 to 2014 of El Salvador. No data until 1998. Number of actual observations by date: 16.
Source name:
World Development Indicators
Source organization:
International Monetary Fund, Government Finance Statistics Yearbook and data files.
Categories, topics:
Public Sector
Last updated:
apr 23, 2017
Indicators value changes by year
Minimum:
-919.3 mln
jan 1, 2014
Maximum:
5.586 bln
jan 1, 1999
At the date of observation
Value
Absolute change
Change from previous value
jan 1, 1999
5.586 bln
+5.586 bln
0.0%
jan 1, 2000
282.7 mln
-5.303 bln
-94.94%
jan 1, 2001
1.234 bln
+950.8 mln
336.33%
jan 1, 2002
279.6 mln
-953.9 mln
-77.33%
jan 1, 2003
-78.5 mln
-358.1 mln
-128.08%
jan 1, 2004
-230.6 mln
-152.1 mln
193.76%
jan 1, 2005
-455.0 mln
-224.4 mln
97.31%
jan 1, 2006
471.4 mln
+926.4 mln
-203.6%
jan 1, 2007
132.9 mln
-338.5 mln
-71.81%
jan 1, 2008
58.7 mln
-74.2 mln
-55.83%
jan 1, 2009
-269.0 mln
-327.7 mln
-558.26%
jan 1, 2010
614.1 mln
+883.1 mln
-328.29%
jan 1, 2011
-312.0 mln
-926.1 mln
-150.81%
jan 1, 2012
27.149 mln
+339.149 mln
-108.7%
jan 1, 2013
1.173 bln
+1.146 bln
4.22K%
jan 1, 2014
-919.3 mln
-2.092 bln
-178.37%
Ranking of countries by current statistics by years


Comments: