29
/
en
AIzaSyAYiBZKx7MnpbEhh9jyipgxe19OcubqV5w
April 1, 2024
255458
Swaziland
SWZ
true
2
1
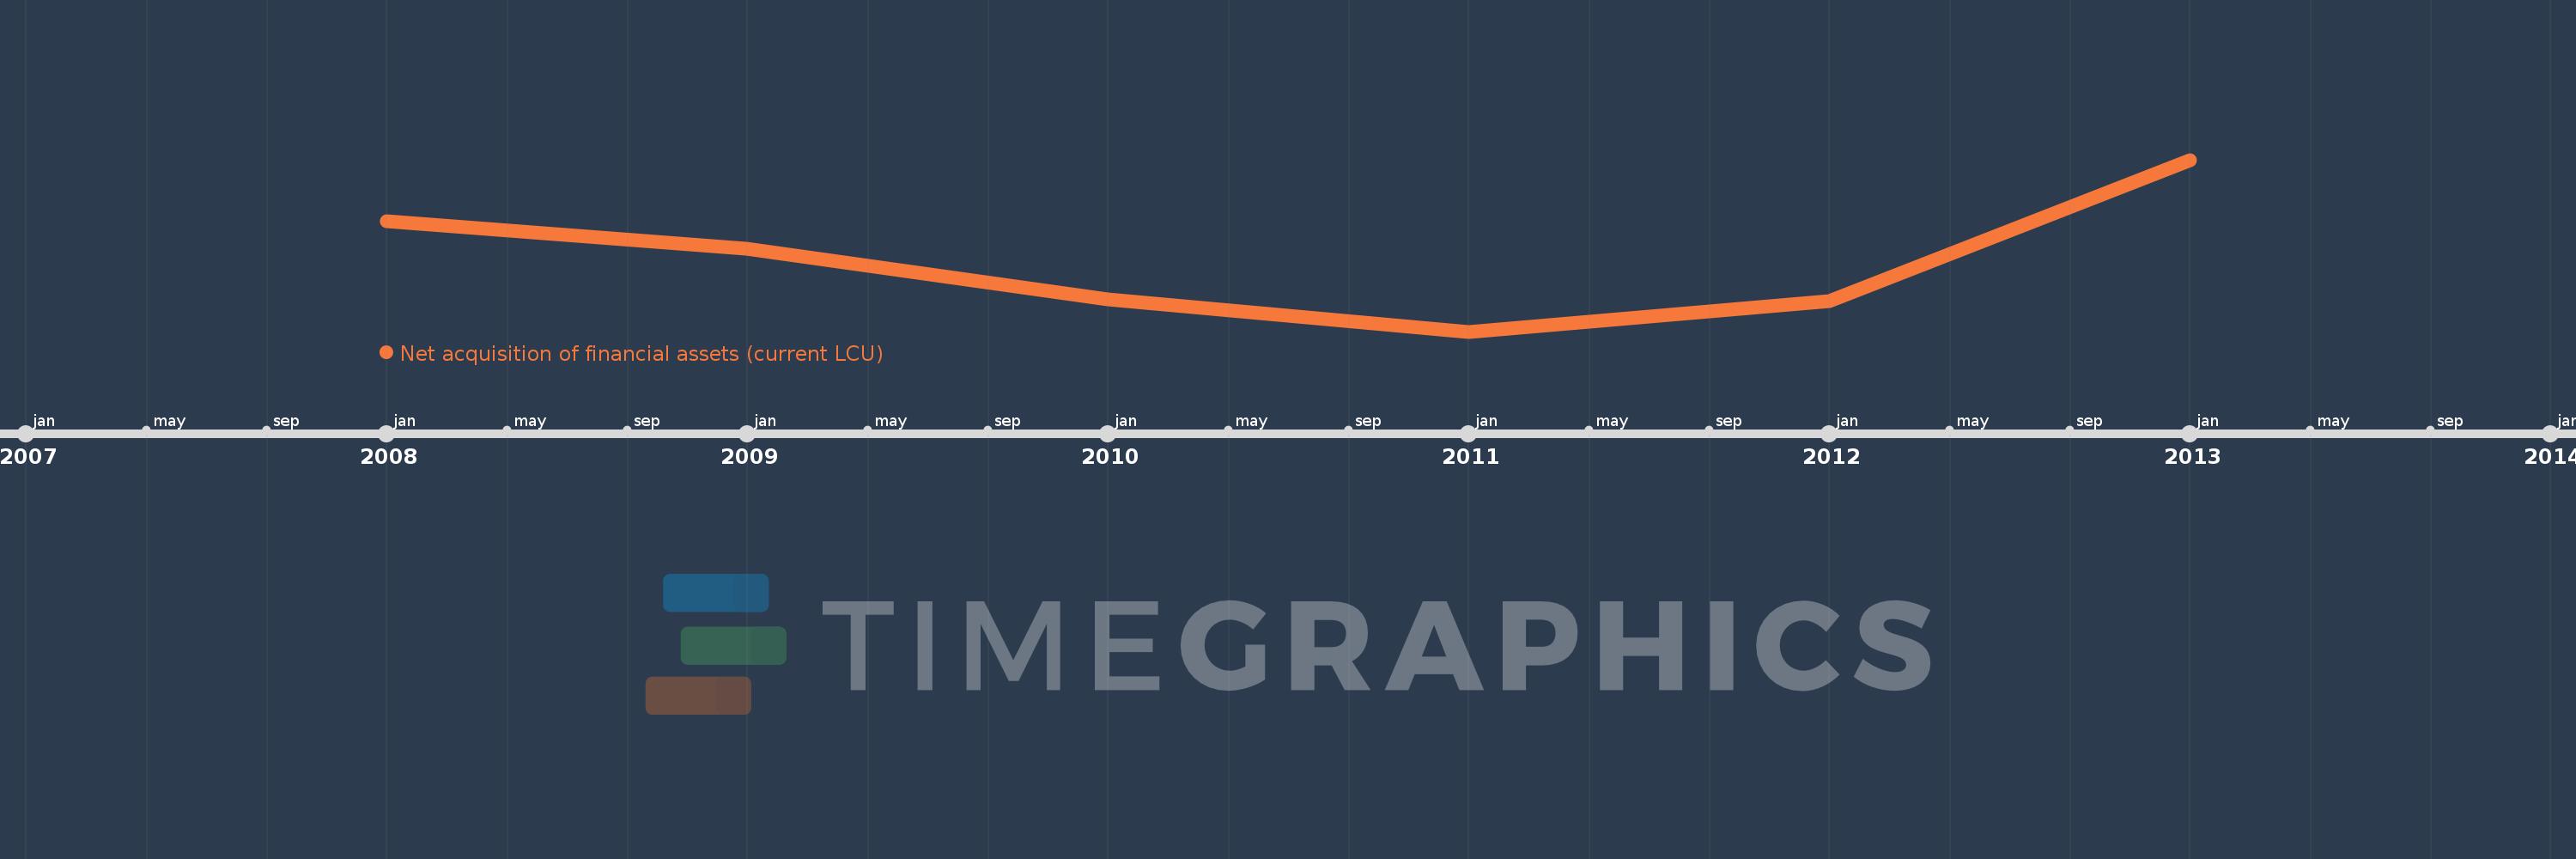
Net acquisition of financial assets (current LCU)
2013,2012,2011,2010,2009,2008
This statistics in other country:
Timeline:
This timeline shows a graph from 2008 to 2013 of Swaziland. No data until 2007. Number of actual observations by date: 6.
Source name:
World Development Indicators
Source organization:
International Monetary Fund, Government Finance Statistics Yearbook and data files.
Categories, topics:
Public Sector
Last updated:
apr 23, 2017
Indicators value changes by year
Minimum:
-3.416 bln
jan 1, 2011
Maximum:
1.987 bln
jan 1, 2013
At the date of observation
Value
Absolute change
Change from previous value
jan 1, 2008
56.6 mln
+56.6 mln
0.0%
jan 1, 2009
-807.538 mln
-864.138 mln
-1.53K%
jan 1, 2010
-2.414 bln
-1.607 bln
198.96%
jan 1, 2011
-3.416 bln
-1.002 bln
41.5%
jan 1, 2012
-2.455 bln
+961.238 mln
-28.14%
jan 1, 2013
1.987 bln
+4.442 bln
-180.95%
Ranking of countries by current statistics by years


Comments: