29
/
en
AIzaSyAYiBZKx7MnpbEhh9jyipgxe19OcubqV5w
April 1, 2024
84411
Benin
BEN
true
2
1
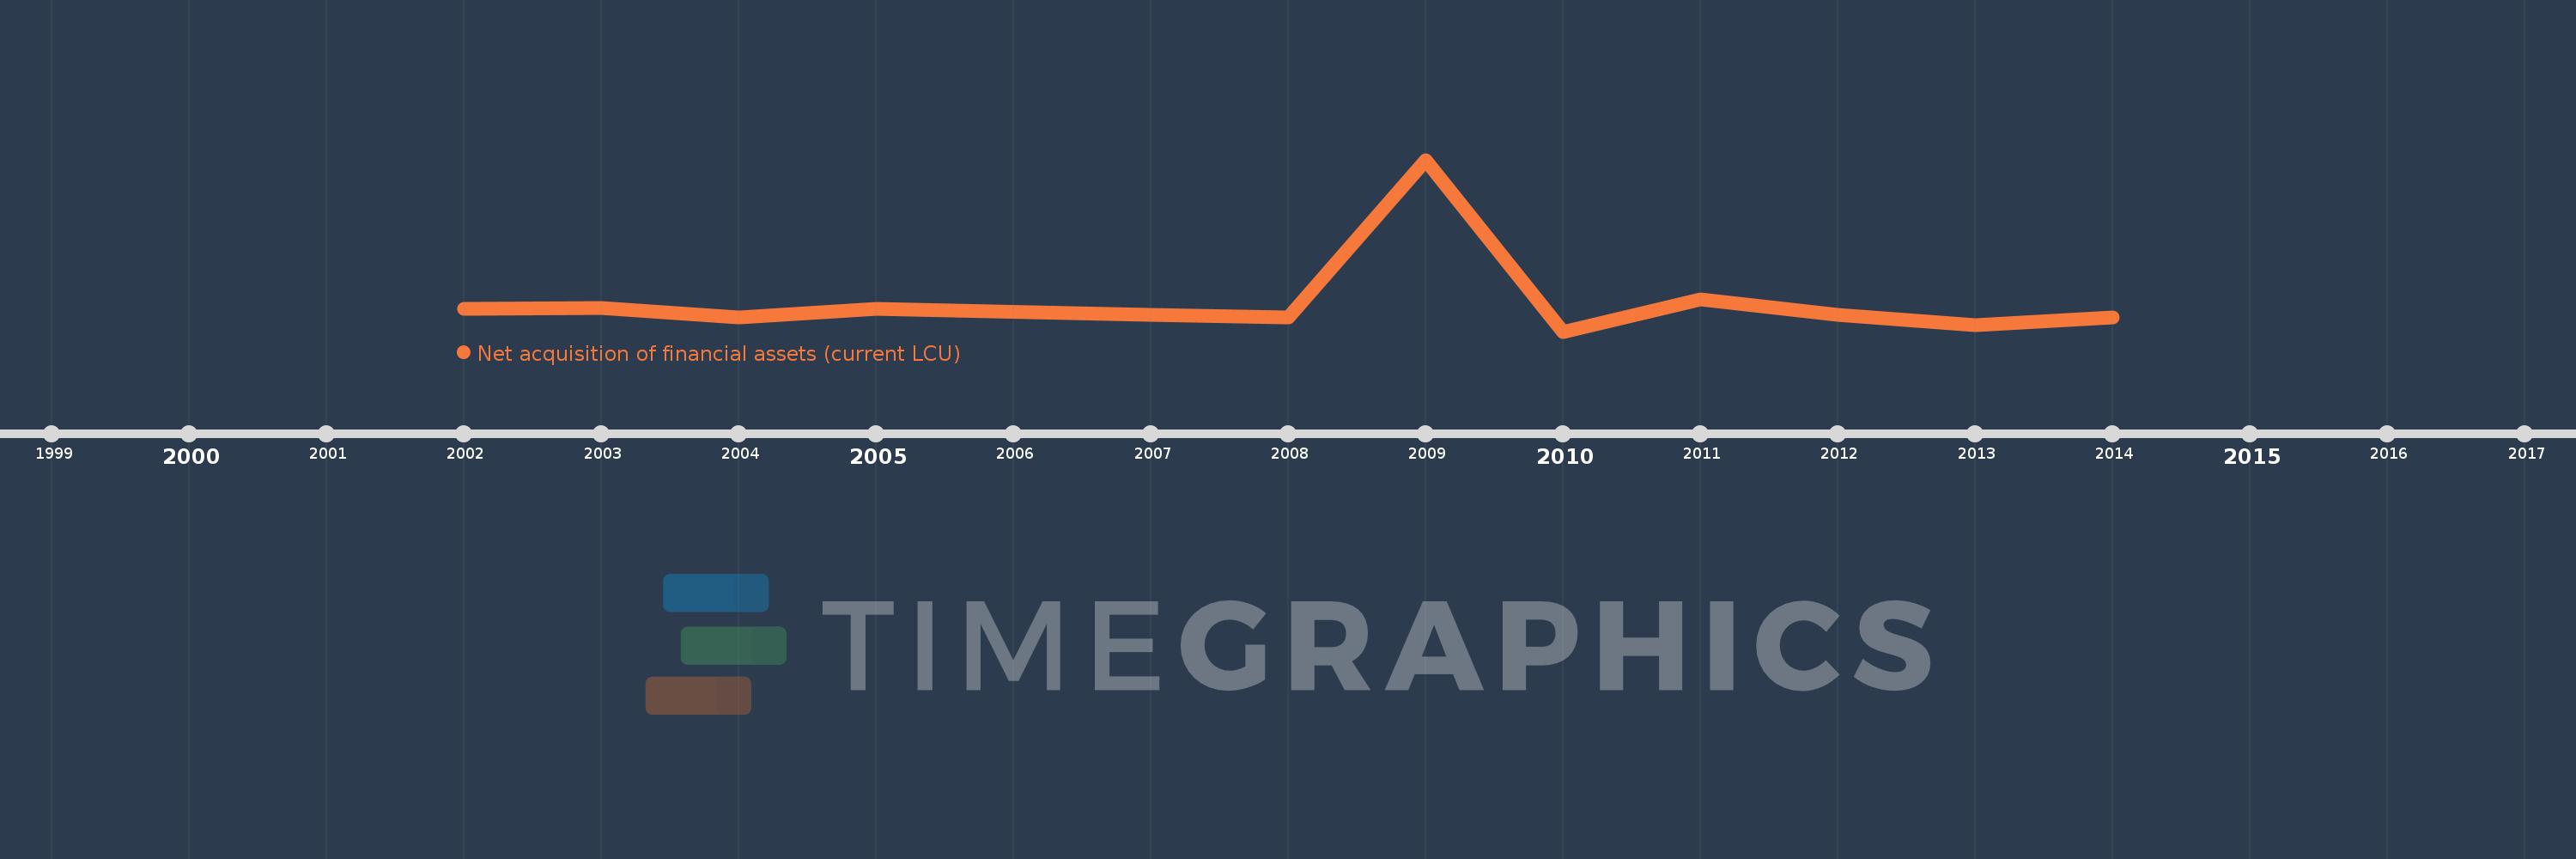
Net acquisition of financial assets (current LCU)
2014,2013,2012,2011,2010,2009,2008,2007,2005,2004,2003,2002
This statistics in other country:
Timeline:
This timeline shows a graph from 2002 to 2014 of Benin. No data until 2001. Number of actual observations by date: 12.
Source name:
World Development Indicators
Source organization:
International Monetary Fund, Government Finance Statistics Yearbook and data files.
Categories, topics:
Public Sector
Last updated:
apr 23, 2017
Indicators value changes by year
Minimum:
-27.378 bln
jan 1, 2010
Maximum:
240.21 bln
jan 1, 2009
At the date of observation
Value
Absolute change
Change from previous value
jan 1, 2002
7.888 bln
+7.888 bln
0.0%
jan 1, 2003
8.93 bln
+1.042 bln
13.21%
jan 1, 2004
-5.724 bln
-14.655 bln
-164.1%
jan 1, 2005
8.153 bln
+13.877 bln
-242.42%
jan 1, 2007
-1.88 bln
-10.033 bln
-123.06%
jan 1, 2008
-4.907 bln
-3.027 bln
160.96%
jan 1, 2009
240.21 bln
+245.117 bln
-5.0K%
jan 1, 2010
-27.378 bln
-267.588 bln
-111.4%
jan 1, 2011
22.437 bln
+49.815 bln
-181.95%
jan 1, 2012
-905.666 mln
-23.343 bln
-104.04%
jan 1, 2013
-16.748 bln
-15.842 bln
1.75K%
jan 1, 2014
-5.7 bln
+11.048 bln
-65.97%
Ranking of countries by current statistics by years


Comments: