29
/
en
AIzaSyAYiBZKx7MnpbEhh9jyipgxe19OcubqV5w
April 1, 2024
91484
Brazil
BRA
true
2
1
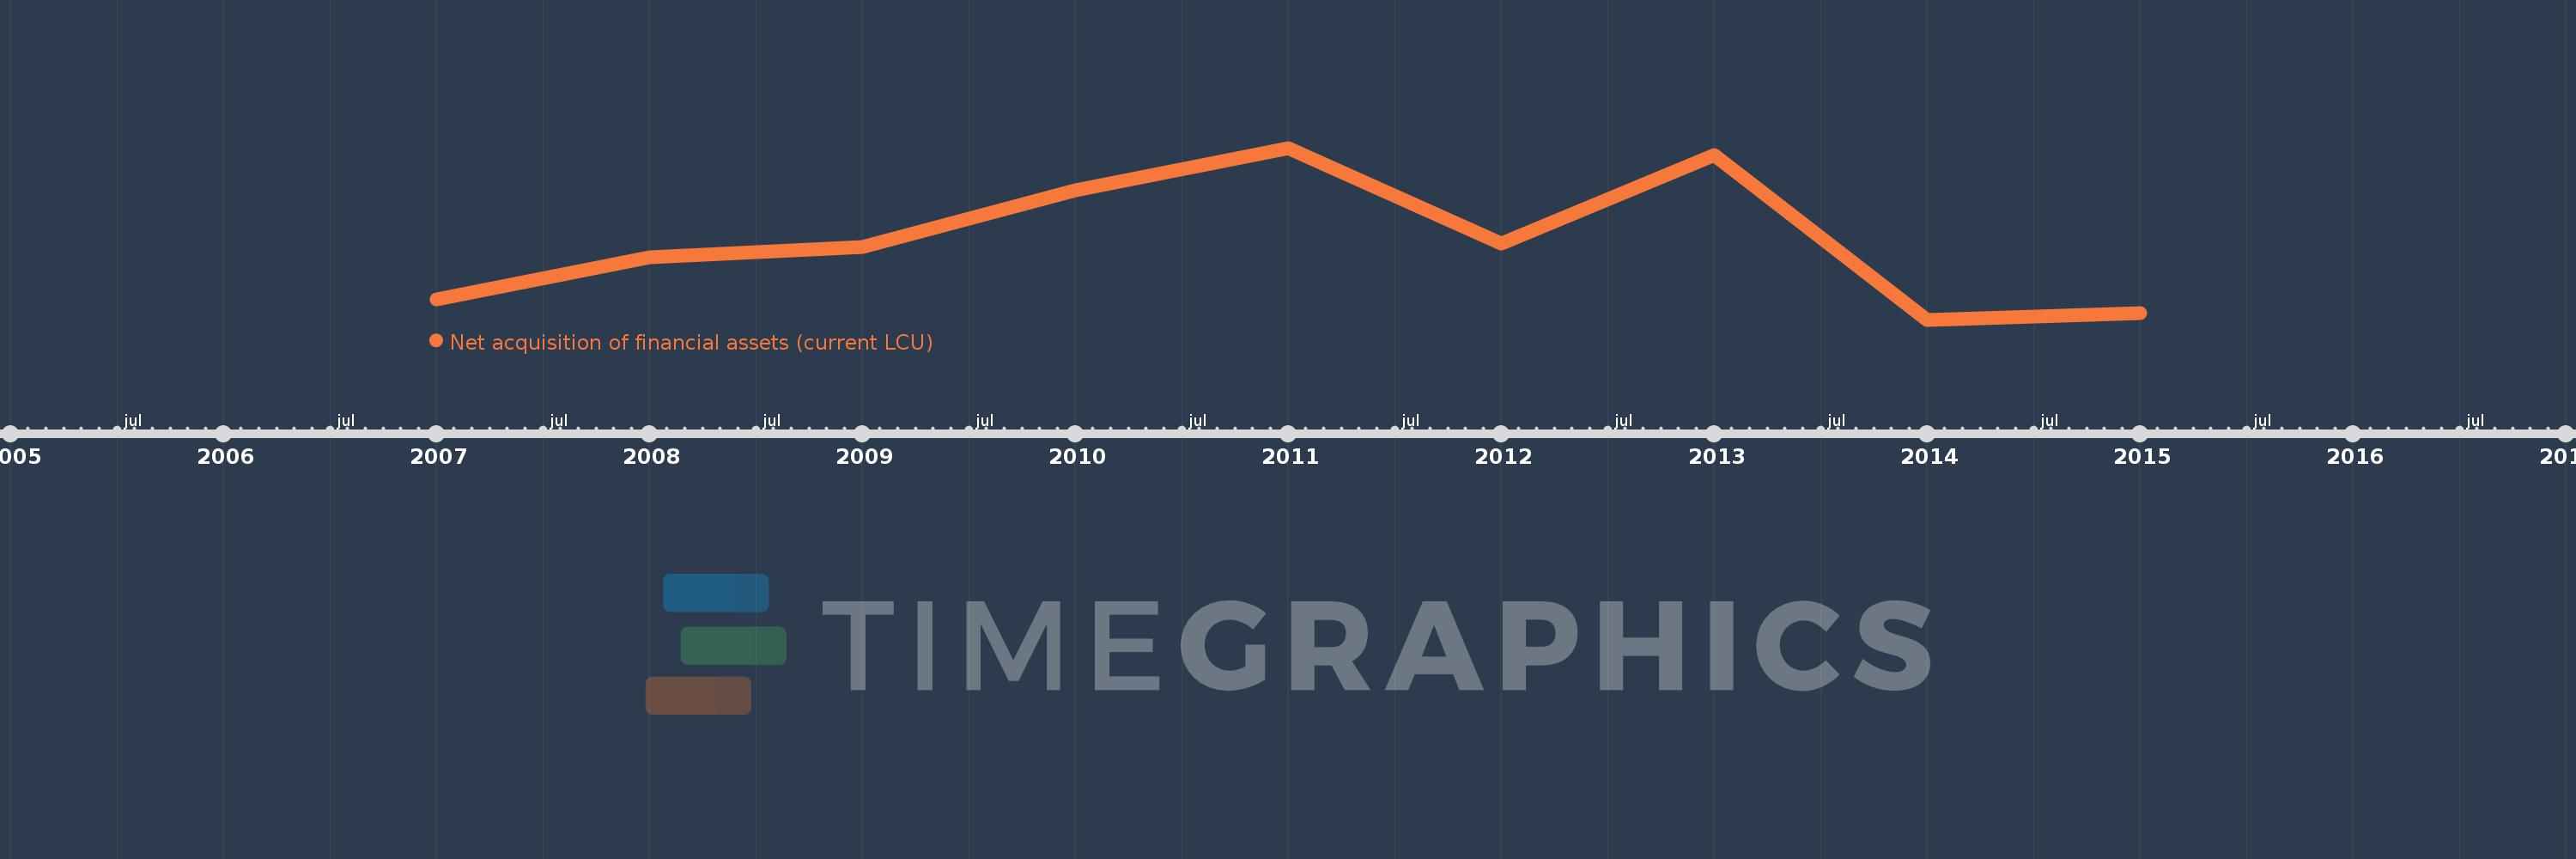
Net acquisition of financial assets (current LCU)
2015,2014,2013,2012,2011,2010,2009,2008,2007
This statistics in other country:
Timeline:
This timeline shows a graph from 2007 to 2015 of Brazil. No data until 2006. Number of actual observations by date: 9.
Source name:
World Development Indicators
Source organization:
International Monetary Fund, Government Finance Statistics Yearbook and data files.
Categories, topics:
Public Sector
Last updated:
apr 23, 2017
Indicators value changes by year
Minimum:
12.982 bln
jan 1, 2014
Maximum:
190.753 bln
jan 1, 2011
At the date of observation
Value
Absolute change
Change from previous value
jan 1, 2007
34.128 bln
+34.128 bln
0.0%
jan 1, 2008
77.172 bln
+43.044 bln
126.13%
jan 1, 2009
88.0 bln
+10.828 bln
14.03%
jan 1, 2010
146.88 bln
+58.88 bln
66.91%
jan 1, 2011
190.753 bln
+43.873 bln
29.87%
jan 1, 2012
91.964 bln
-98.789 bln
-51.79%
jan 1, 2013
183.749 bln
+91.785 bln
99.81%
jan 1, 2014
12.982 bln
-170.767 bln
-92.94%
jan 1, 2015
19.425 bln
+6.443 bln
49.64%
Ranking of countries by current statistics by years


Comments: