29
/
en
AIzaSyAYiBZKx7MnpbEhh9jyipgxe19OcubqV5w
April 1, 2024
271998
Uganda
UGA
true
2
1
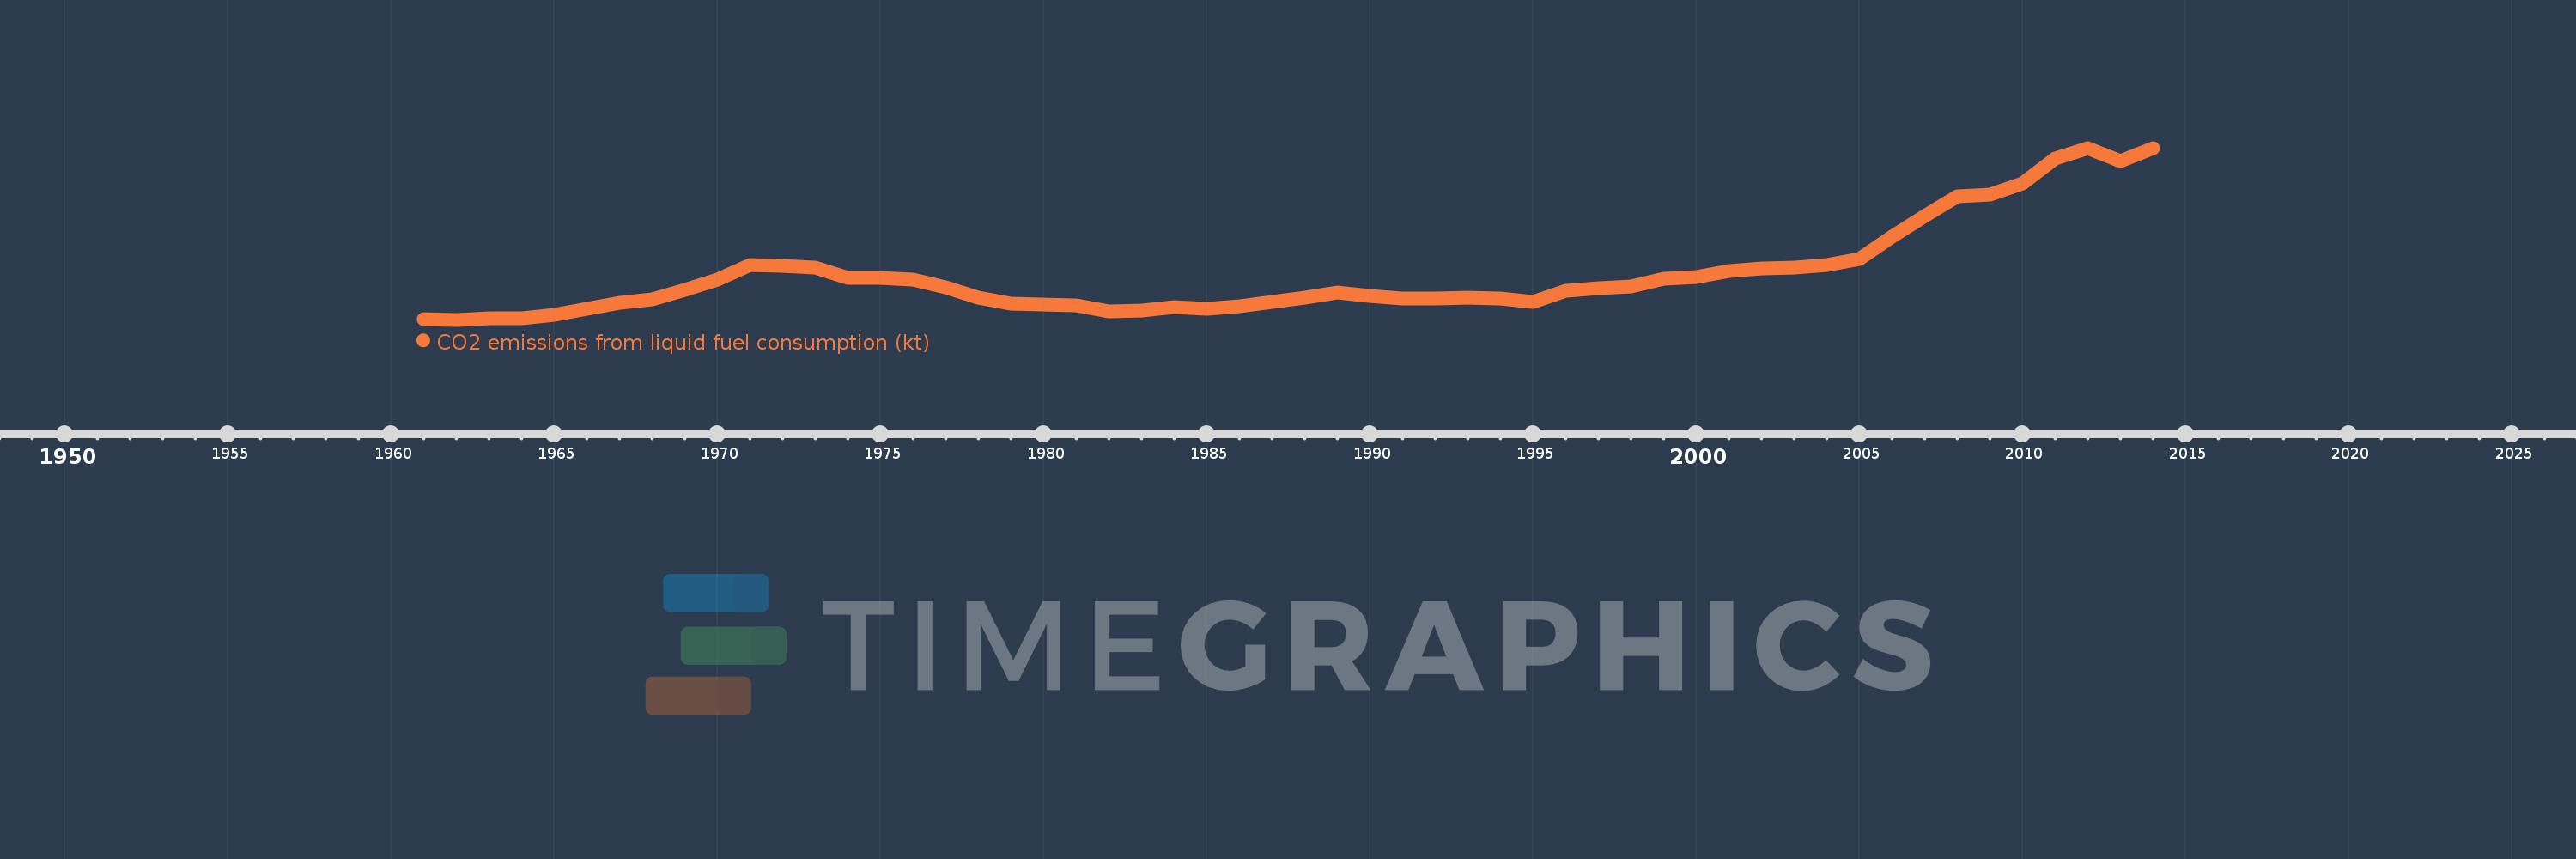
CO2 emissions from liquid fuel consumption (kt)
2014,2013,2012,2011,2010,2009,2008,2007,2006,2005,2004,2003,2002,2001,2000,1999,1998,1997,1996,1995,1994,1993,1992,1991,1990,1989,1988,1987,1986,1985,1984,1983,1982,1981,1980,1979,1978,1977,1976,1975,1974,1973,1972,1971,1970,1969,1968,1967,1966,1965,1964,1963,1962,1961
This statistics in other country:
AfghanistanAlbaniaAlgeriaAndorraAngolaAntigua and BarbudaArab WorldArgentinaArmeniaArubaAustraliaAustriaAzerbaijanBahamas, TheBahrainBangladeshBarbadosBelarusBelgiumBelizeBeninBermudaBhutanBoliviaBosnia and HerzegovinaBotswanaBrazilBritish Virgin IslandsBrunei DarussalamBulgariaBurkina FasoBurundiCabo VerdeCambodiaCameroonCanadaCaribbean small statesCayman IslandsCentral African RepublicCentral Europe and the BalticsChadChileChinaColombiaComorosCongo, Dem. Rep.Congo, Rep.Costa RicaCote d'IvoireCroatiaCubaCuracaoCyprusCzech RepublicDenmarkDjiboutiDominicaDominican RepublicEarly-demographic dividendEast Asia & PacificEast Asia & Pacific (excluding high income)East Asia & Pacific (IDA & IBRD countries)EcuadorEgypt, Arab Rep.El SalvadorEquatorial GuineaEritreaEstoniaEthiopiaEuro areaEurope & Central AsiaEurope & Central Asia (excluding high income)Europe & Central Asia (IDA & IBRD countries)European UnionFaroe IslandsFijiFinlandFragile and conflict affected situationsFranceFrench PolynesiaGabonGambia, TheGeorgiaGermanyGhanaGibraltarGreeceGreenlandGrenadaGuatemalaGuineaGuinea-BissauGuyanaHaitiHeavily indebted poor countries (HIPC)High incomeHondurasHong Kong SAR, ChinaHungaryIBRD onlyIcelandIDA & IBRD totalIDA blendIDA onlyIDA totalIndiaIndonesiaIran, Islamic Rep.IraqIrelandIsraelItalyJamaicaJapanJordanKazakhstanKenyaKiribatiKorea, Dem. People’s Rep.Korea, Rep.KuwaitKyrgyz RepublicLao PDRLate-demographic dividendLatin America & Caribbean Latin America & Caribbean (excluding high income)Latin America & the Caribbean (IDA & IBRD countries)LatviaLeast developed countries: UN classificationLebanonLesothoLiberiaLibyaLiechtensteinLithuaniaLow & middle incomeLow incomeLower middle incomeLuxembourgMacao SAR, ChinaMacedonia, FYRMadagascarMalawiMalaysiaMaldivesMaliMaltaMarshall IslandsMauritaniaMauritiusMexicoMicronesia, Fed. Sts.Middle East & North AfricaMiddle East & North Africa (excluding high income)Middle East & North Africa (IDA & IBRD countries)Middle incomeMoldovaMongoliaMontenegroMoroccoMozambiqueMyanmarNamibiaNauruNepalNetherlandsNew CaledoniaNew ZealandNicaraguaNigerNigeriaNorth AmericaNorwayOECD membersOmanOther small statesPacific island small statesPakistanPalauPanamaPapua New GuineaParaguayPeruPhilippinesPolandPortugalPost-demographic dividendPre-demographic dividendQatarRomaniaRussian FederationRwandaSamoaSao Tome and PrincipeSaudi ArabiaSenegalSerbiaSeychellesSierra LeoneSingaporeSint Maarten (Dutch part)Slovak RepublicSloveniaSmall statesSolomon IslandsSomaliaSouth AfricaSouth AsiaSouth Asia (IDA & IBRD)South SudanSpainSri LankaSt. Kitts and NevisSt. LuciaSt. Vincent and the GrenadinesSub-Saharan Africa Sub-Saharan Africa (excluding high income)Sub-Saharan Africa (IDA & IBRD countries)SudanSurinameSwazilandSwedenSwitzerlandSyrian Arab RepublicTajikistanTanzaniaThailandTimor-LesteTogoTongaTrinidad and TobagoTunisiaTurkeyTurkmenistanTurks and Caicos IslandsUgandaUkraineUnited Arab EmiratesUnited KingdomUnited StatesUpper middle incomeUruguayUzbekistanVanuatuVenezuela, RBVietnamWest Bank and GazaWorldYemen, Rep.ZambiaZimbabwe Timeline:
This timeline shows a graph from 1961 to 2014 of Uganda. No data until 1960. Number of actual observations by date: 54.
Source name:
World Development Indicators
Source organization:
Carbon Dioxide Information Analysis Center, Environmental Sciences Division, Oak Ridge National Laboratory, Tennessee, United States.
Categories, topics:
Energy & Mining, Climate Change, Environment
Last updated:
apr 23, 2017
Indicators value changes by year
Minimum:
374.034
jan 1, 1962
Maximum:
3.432K
jan 1, 2012
At the date of observation
Value
Absolute change
Change from previous value
jan 1, 1961
385.035
+385.035
0.0%
jan 1, 1962
374.034
-11.001
-2.86%
jan 1, 1963
399.703
+25.669
6.86%
jan 1, 1964
407.037
+7.334
1.83%
jan 1, 1965
454.708
+47.671
11.71%
jan 1, 1966
561.051
+106.343
23.39%
jan 1, 1967
674.728
+113.677
20.26%
jan 1, 1968
740.734
+66.006
9.78%
jan 1, 1969
905.749
+165.015
22.28%
jan 1, 1970
1.089K
+183.35
20.24%
jan 1, 1971
1.349K
+260.357
23.91%
jan 1, 1972
1.338K
-11.001
-0.82%
jan 1, 1973
1.298K
-40.337
-3.01%
jan 1, 1974
1.111K
-187.017
-14.41%
jan 1, 1975
1.118K
+7.334
0.66%
jan 1, 1976
1.085K
-33.003
-2.95%
jan 1, 1977
946.086
-139.346
-12.84%
jan 1, 1978
766.403
-179.683
-18.99%
jan 1, 1979
660.06
-106.343
-13.88%
jan 1, 1980
649.059
-11.001
-1.67%
jan 1, 1981
623.39
-25.669
-3.95%
jan 1, 1982
524.381
-99.009
-15.88%
jan 1, 1983
539.049
+14.668
2.8%
jan 1, 1984
605.055
+66.006
12.24%
jan 1, 1985
572.052
-33.003
-5.45%
jan 1, 1986
608.722
+36.67
6.41%
jan 1, 1987
696.73
+88.008
14.46%
jan 1, 1988
766.403
+69.673
10.0%
jan 1, 1989
858.078
+91.675
11.96%
jan 1, 1990
795.739
-62.339
-7.26%
jan 1, 1991
744.401
-51.338
-6.45%
jan 1, 1992
755.402
+11.001
1.48%
jan 1, 1993
762.736
+7.334
0.97%
jan 1, 1994
755.402
-7.334
-0.96%
jan 1, 1995
689.396
-66.006
-8.74%
jan 1, 1996
894.748
+205.352
29.79%
jan 1, 1997
935.085
+40.337
4.51%
jan 1, 1998
964.421
+29.336
3.14%
jan 1, 1999
1.104K
+139.346
14.45%
jan 1, 2000
1.14K
+36.67
3.32%
jan 1, 2001
1.247K
+106.343
9.32%
jan 1, 2002
1.294K
+47.671
3.82%
jan 1, 2003
1.305K
+11.001
0.85%
jan 1, 2004
1.346K
+40.337
3.09%
jan 1, 2005
1.459K
+113.677
8.45%
jan 1, 2006
1.856K
+396.036
27.14%
jan 1, 2007
2.222K
+366.7
19.76%
jan 1, 2008
2.567K
+344.698
15.51%
jan 1, 2009
2.596K
+29.336
1.14%
jan 1, 2010
2.802K
+205.352
7.91%
jan 1, 2011
3.249K
+447.374
15.97%
jan 1, 2012
3.432K
+183.35
5.64%
jan 1, 2013
3.198K
-234.688
-6.84%
jan 1, 2014
3.429K
+231.021
7.22%
Ranking of countries by current statistics by years


Comments: