29
/
en
AIzaSyAYiBZKx7MnpbEhh9jyipgxe19OcubqV5w
April 1, 2024
201337
Morocco
MAR
true
2
1
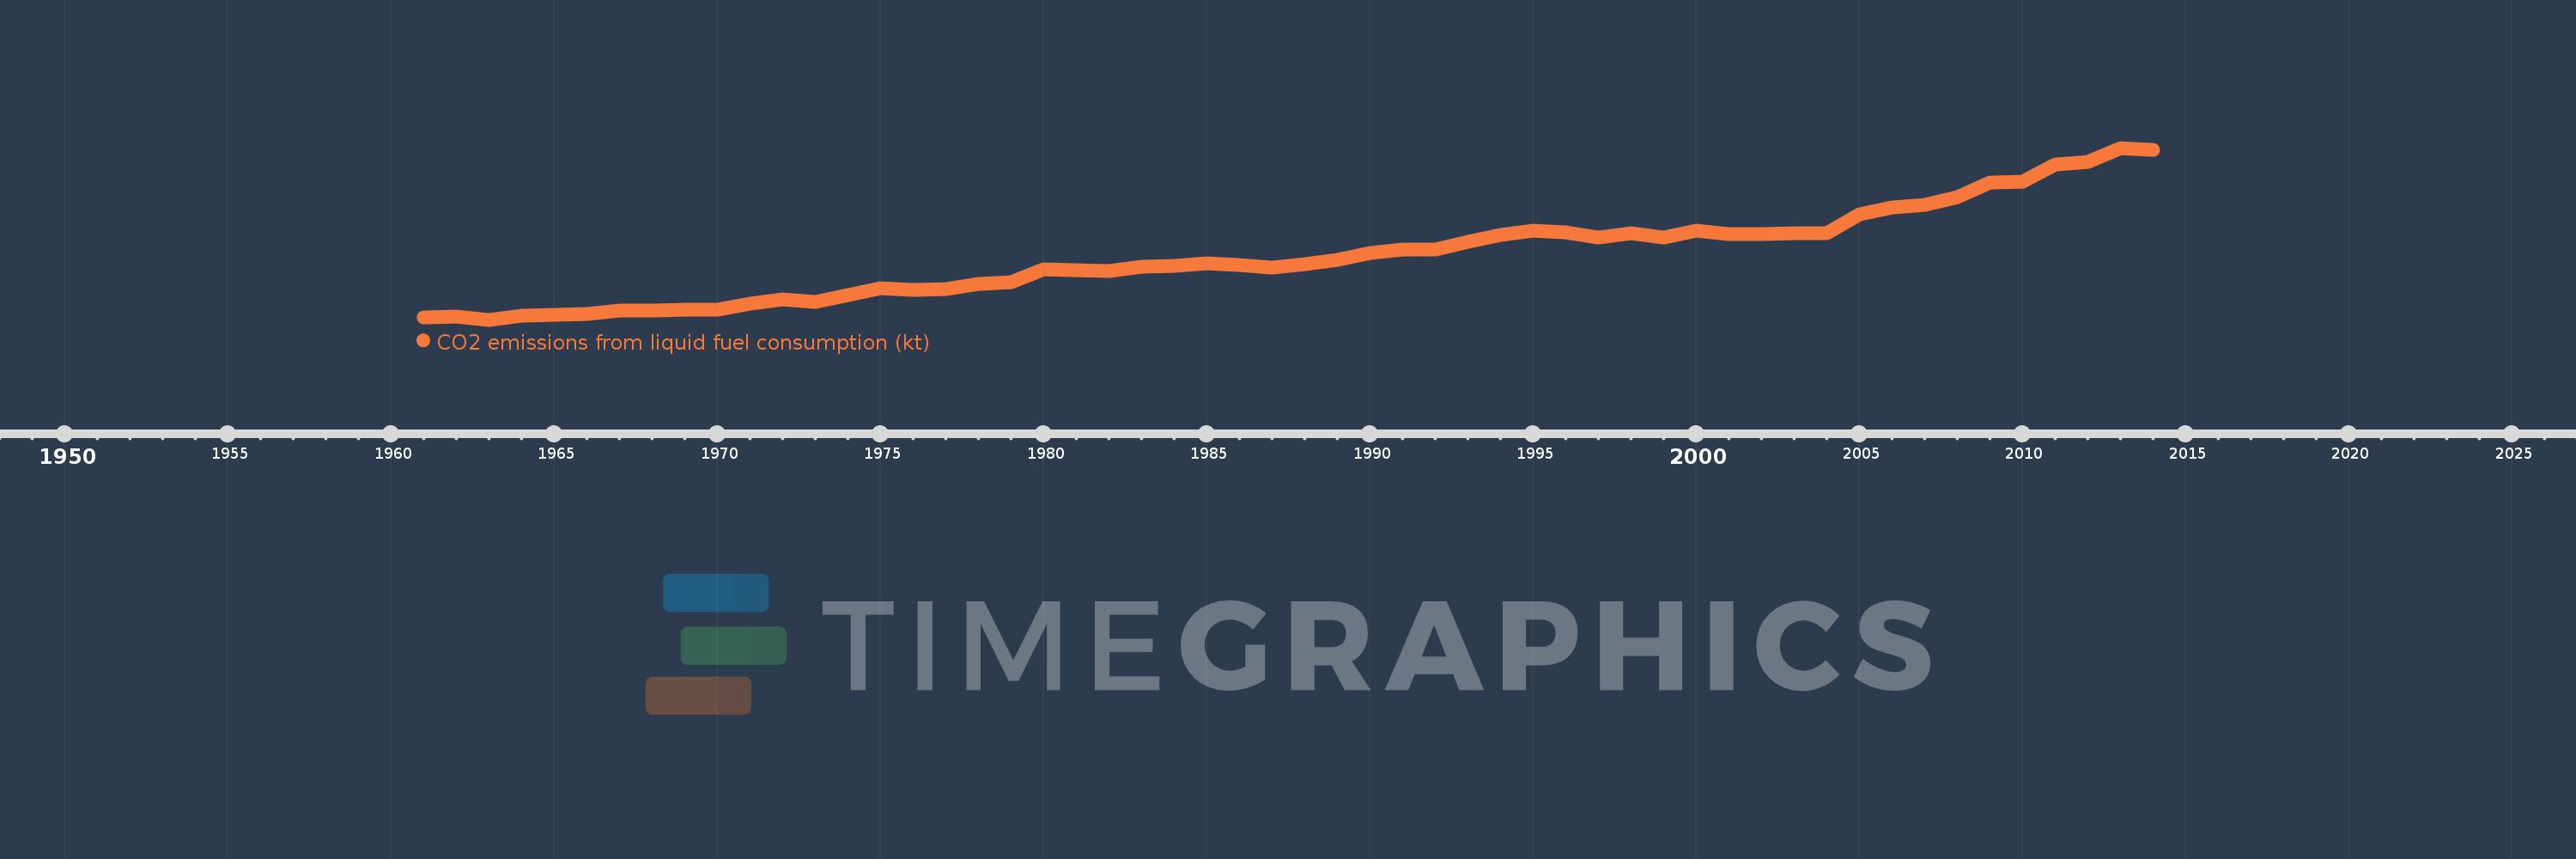
CO2 emissions from liquid fuel consumption (kt)
2014,2013,2012,2011,2010,2009,2008,2007,2006,2005,2004,2003,2002,2001,2000,1999,1998,1997,1996,1995,1994,1993,1992,1991,1990,1989,1988,1987,1986,1985,1984,1983,1982,1981,1980,1979,1978,1977,1976,1975,1974,1973,1972,1971,1970,1969,1968,1967,1966,1965,1964,1963,1962,1961
This statistics in other country:
AfghanistanAlbaniaAlgeriaAndorraAngolaAntigua and BarbudaArab WorldArgentinaArmeniaArubaAustraliaAustriaAzerbaijanBahamas, TheBahrainBangladeshBarbadosBelarusBelgiumBelizeBeninBermudaBhutanBoliviaBosnia and HerzegovinaBotswanaBrazilBritish Virgin IslandsBrunei DarussalamBulgariaBurkina FasoBurundiCabo VerdeCambodiaCameroonCanadaCaribbean small statesCayman IslandsCentral African RepublicCentral Europe and the BalticsChadChileChinaColombiaComorosCongo, Dem. Rep.Congo, Rep.Costa RicaCote d'IvoireCroatiaCubaCuracaoCyprusCzech RepublicDenmarkDjiboutiDominicaDominican RepublicEarly-demographic dividendEast Asia & PacificEast Asia & Pacific (excluding high income)East Asia & Pacific (IDA & IBRD countries)EcuadorEgypt, Arab Rep.El SalvadorEquatorial GuineaEritreaEstoniaEthiopiaEuro areaEurope & Central AsiaEurope & Central Asia (excluding high income)Europe & Central Asia (IDA & IBRD countries)European UnionFaroe IslandsFijiFinlandFragile and conflict affected situationsFranceFrench PolynesiaGabonGambia, TheGeorgiaGermanyGhanaGibraltarGreeceGreenlandGrenadaGuatemalaGuineaGuinea-BissauGuyanaHaitiHeavily indebted poor countries (HIPC)High incomeHondurasHong Kong SAR, ChinaHungaryIBRD onlyIcelandIDA & IBRD totalIDA blendIDA onlyIDA totalIndiaIndonesiaIran, Islamic Rep.IraqIrelandIsraelItalyJamaicaJapanJordanKazakhstanKenyaKiribatiKorea, Dem. People’s Rep.Korea, Rep.KuwaitKyrgyz RepublicLao PDRLate-demographic dividendLatin America & Caribbean Latin America & Caribbean (excluding high income)Latin America & the Caribbean (IDA & IBRD countries)LatviaLeast developed countries: UN classificationLebanonLesothoLiberiaLibyaLiechtensteinLithuaniaLow & middle incomeLow incomeLower middle incomeLuxembourgMacao SAR, ChinaMacedonia, FYRMadagascarMalawiMalaysiaMaldivesMaliMaltaMarshall IslandsMauritaniaMauritiusMexicoMicronesia, Fed. Sts.Middle East & North AfricaMiddle East & North Africa (excluding high income)Middle East & North Africa (IDA & IBRD countries)Middle incomeMoldovaMongoliaMontenegroMoroccoMozambiqueMyanmarNamibiaNauruNepalNetherlandsNew CaledoniaNew ZealandNicaraguaNigerNigeriaNorth AmericaNorwayOECD membersOmanOther small statesPacific island small statesPakistanPalauPanamaPapua New GuineaParaguayPeruPhilippinesPolandPortugalPost-demographic dividendPre-demographic dividendQatarRomaniaRussian FederationRwandaSamoaSao Tome and PrincipeSaudi ArabiaSenegalSerbiaSeychellesSierra LeoneSingaporeSint Maarten (Dutch part)Slovak RepublicSloveniaSmall statesSolomon IslandsSomaliaSouth AfricaSouth AsiaSouth Asia (IDA & IBRD)South SudanSpainSri LankaSt. Kitts and NevisSt. LuciaSt. Vincent and the GrenadinesSub-Saharan Africa Sub-Saharan Africa (excluding high income)Sub-Saharan Africa (IDA & IBRD countries)SudanSurinameSwazilandSwedenSwitzerlandSyrian Arab RepublicTajikistanTanzaniaThailandTimor-LesteTogoTongaTrinidad and TobagoTunisiaTurkeyTurkmenistanTurks and Caicos IslandsUgandaUkraineUnited Arab EmiratesUnited KingdomUnited StatesUpper middle incomeUruguayUzbekistanVanuatuVenezuela, RBVietnamWest Bank and GazaWorldYemen, Rep.ZambiaZimbabwe Timeline:
This timeline shows a graph from 1961 to 2014 of Morocco. No data until 1960. Number of actual observations by date: 54.
Source name:
World Development Indicators
Source organization:
Carbon Dioxide Information Analysis Center, Environmental Sciences Division, Oak Ridge National Laboratory, Tennessee, United States.
Categories, topics:
Energy & Mining, Climate Change, Environment
Last updated:
apr 23, 2017
Indicators value changes by year
Minimum:
1.918K
jan 1, 1963
Maximum:
37.821K
jan 1, 2013
At the date of observation
Value
Absolute change
Change from previous value
jan 1, 1961
2.457K
+2.457K
0.0%
jan 1, 1962
2.582K
+124.678
5.07%
jan 1, 1963
1.918K
-663.727
-25.71%
jan 1, 1964
2.714K
+795.739
41.49%
jan 1, 1965
2.945K
+231.021
8.51%
jan 1, 1966
3.073K
+128.345
4.36%
jan 1, 1967
3.821K
+748.068
24.34%
jan 1, 1968
3.781K
-40.337
-1.06%
jan 1, 1969
4.048K
+267.691
7.08%
jan 1, 1970
4.107K
+58.672
1.45%
jan 1, 1971
5.291K
+1.184K
28.84%
jan 1, 1972
6.098K
+806.74
15.25%
jan 1, 1973
5.581K
-517.047
-8.48%
jan 1, 1974
7.132K
+1.551K
27.79%
jan 1, 1975
8.507K
+1.375K
19.28%
jan 1, 1976
8.188K
-319.029
-3.75%
jan 1, 1977
8.309K
+121.011
1.48%
jan 1, 1978
9.329K
+1.019K
12.27%
jan 1, 1979
9.688K
+359.366
3.85%
jan 1, 1980
12.402K
+2.714K
28.01%
jan 1, 1981
12.339K
-62.339
-0.5%
jan 1, 1982
12.072K
-267.691
-2.17%
jan 1, 1983
13.025K
+953.42
7.9%
jan 1, 1984
13.22K
+194.351
1.49%
jan 1, 1985
13.718K
+498.712
3.77%
jan 1, 1986
13.403K
-315.362
-2.3%
jan 1, 1987
12.82K
-583.053
-4.35%
jan 1, 1988
13.553K
+733.4
5.72%
jan 1, 1989
14.477K
+924.084
6.82%
jan 1, 1990
15.922K
+1.445K
9.98%
jan 1, 1991
16.652K
+729.733
4.58%
jan 1, 1992
16.601K
-51.338
-0.31%
jan 1, 1993
18.192K
+1.591K
9.59%
jan 1, 1994
19.681K
+1.489K
8.18%
jan 1, 1995
20.517K
+836.076
4.25%
jan 1, 1996
20.172K
-344.698
-1.68%
jan 1, 1997
19.156K
-1.016K
-5.04%
jan 1, 1998
19.915K
+759.069
3.96%
jan 1, 1999
19.142K
-773.737
-3.89%
jan 1, 2000
20.484K
+1.342K
7.01%
jan 1, 2001
19.739K
-744.401
-3.63%
jan 1, 2002
19.857K
+117.344
0.59%
jan 1, 2003
19.967K
+110.01
0.55%
jan 1, 2004
20.055K
+88.008
0.44%
jan 1, 2005
24.026K
+3.971K
19.8%
jan 1, 2006
25.324K
+1.298K
5.4%
jan 1, 2007
25.955K
+630.724
2.49%
jan 1, 2008
27.55K
+1.595K
6.15%
jan 1, 2009
30.645K
+3.095K
11.23%
jan 1, 2010
30.854K
+209.019
0.68%
jan 1, 2011
34.437K
+3.583K
11.61%
jan 1, 2012
34.866K
+429.039
1.25%
jan 1, 2013
37.821K
+2.956K
8.48%
jan 1, 2014
37.374K
-447.374
-1.18%
Ranking of countries by current statistics by years


Comments: