29
/
en
AIzaSyAYiBZKx7MnpbEhh9jyipgxe19OcubqV5w
April 1, 2024
142504
Greenland
GRL
true
2
1
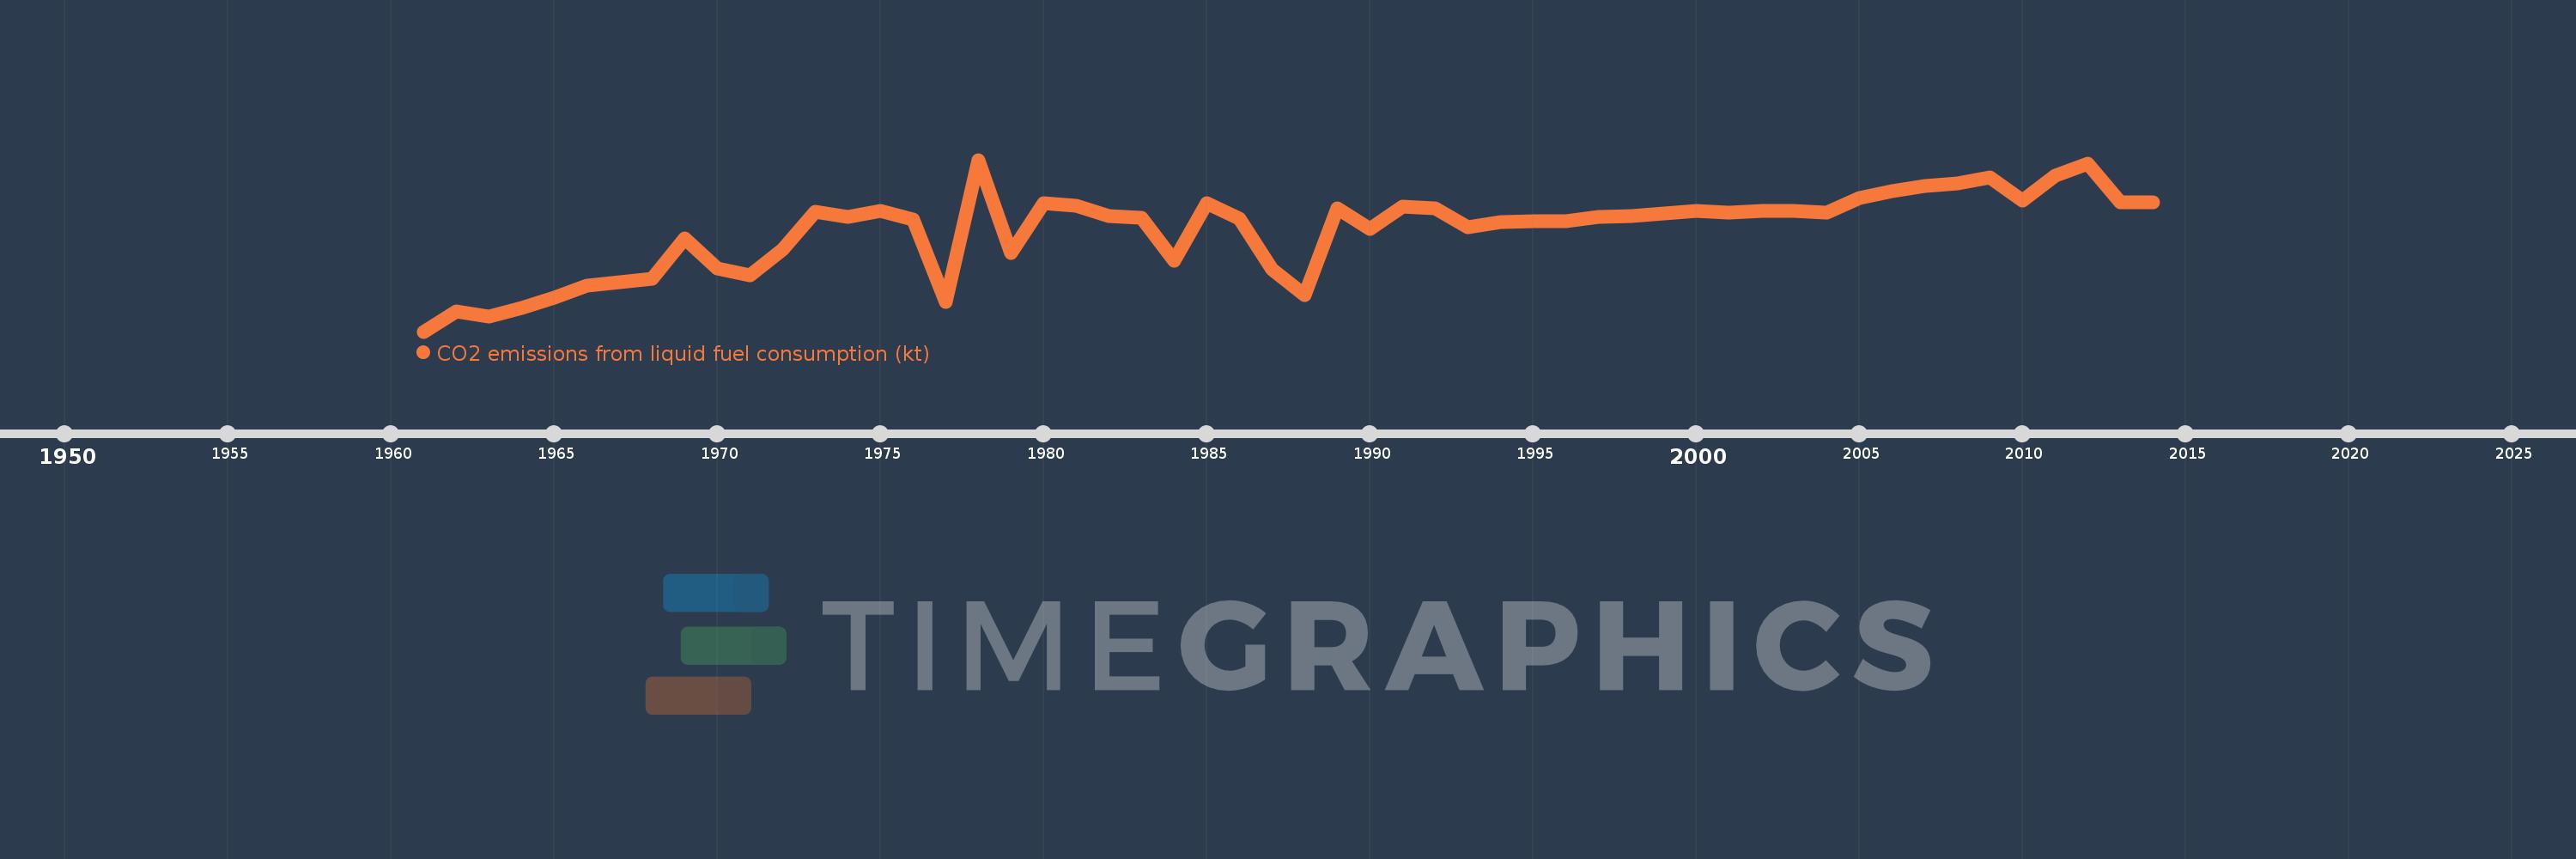
CO2 emissions from liquid fuel consumption (kt)
2014,2013,2012,2011,2010,2009,2008,2007,2006,2005,2004,2003,2002,2001,2000,1999,1998,1997,1996,1995,1994,1993,1992,1991,1990,1989,1988,1987,1986,1985,1984,1983,1982,1981,1980,1979,1978,1977,1976,1975,1974,1973,1972,1971,1970,1969,1968,1967,1966,1965,1964,1963,1962,1961
This statistics in other country:
AfghanistanAlbaniaAlgeriaAndorraAngolaAntigua and BarbudaArab WorldArgentinaArmeniaArubaAustraliaAustriaAzerbaijanBahamas, TheBahrainBangladeshBarbadosBelarusBelgiumBelizeBeninBermudaBhutanBoliviaBosnia and HerzegovinaBotswanaBrazilBritish Virgin IslandsBrunei DarussalamBulgariaBurkina FasoBurundiCabo VerdeCambodiaCameroonCanadaCaribbean small statesCayman IslandsCentral African RepublicCentral Europe and the BalticsChadChileChinaColombiaComorosCongo, Dem. Rep.Congo, Rep.Costa RicaCote d'IvoireCroatiaCubaCuracaoCyprusCzech RepublicDenmarkDjiboutiDominicaDominican RepublicEarly-demographic dividendEast Asia & PacificEast Asia & Pacific (excluding high income)East Asia & Pacific (IDA & IBRD countries)EcuadorEgypt, Arab Rep.El SalvadorEquatorial GuineaEritreaEstoniaEthiopiaEuro areaEurope & Central AsiaEurope & Central Asia (excluding high income)Europe & Central Asia (IDA & IBRD countries)European UnionFaroe IslandsFijiFinlandFragile and conflict affected situationsFranceFrench PolynesiaGabonGambia, TheGeorgiaGermanyGhanaGibraltarGreeceGreenlandGrenadaGuatemalaGuineaGuinea-BissauGuyanaHaitiHeavily indebted poor countries (HIPC)High incomeHondurasHong Kong SAR, ChinaHungaryIBRD onlyIcelandIDA & IBRD totalIDA blendIDA onlyIDA totalIndiaIndonesiaIran, Islamic Rep.IraqIrelandIsraelItalyJamaicaJapanJordanKazakhstanKenyaKiribatiKorea, Dem. People’s Rep.Korea, Rep.KuwaitKyrgyz RepublicLao PDRLate-demographic dividendLatin America & Caribbean Latin America & Caribbean (excluding high income)Latin America & the Caribbean (IDA & IBRD countries)LatviaLeast developed countries: UN classificationLebanonLesothoLiberiaLibyaLiechtensteinLithuaniaLow & middle incomeLow incomeLower middle incomeLuxembourgMacao SAR, ChinaMacedonia, FYRMadagascarMalawiMalaysiaMaldivesMaliMaltaMarshall IslandsMauritaniaMauritiusMexicoMicronesia, Fed. Sts.Middle East & North AfricaMiddle East & North Africa (excluding high income)Middle East & North Africa (IDA & IBRD countries)Middle incomeMoldovaMongoliaMontenegroMoroccoMozambiqueMyanmarNamibiaNauruNepalNetherlandsNew CaledoniaNew ZealandNicaraguaNigerNigeriaNorth AmericaNorwayOECD membersOmanOther small statesPacific island small statesPakistanPalauPanamaPapua New GuineaParaguayPeruPhilippinesPolandPortugalPost-demographic dividendPre-demographic dividendQatarRomaniaRussian FederationRwandaSamoaSao Tome and PrincipeSaudi ArabiaSenegalSerbiaSeychellesSierra LeoneSingaporeSint Maarten (Dutch part)Slovak RepublicSloveniaSmall statesSolomon IslandsSomaliaSouth AfricaSouth AsiaSouth Asia (IDA & IBRD)South SudanSpainSri LankaSt. Kitts and NevisSt. LuciaSt. Vincent and the GrenadinesSub-Saharan Africa Sub-Saharan Africa (excluding high income)Sub-Saharan Africa (IDA & IBRD countries)SudanSurinameSwazilandSwedenSwitzerlandSyrian Arab RepublicTajikistanTanzaniaThailandTimor-LesteTogoTongaTrinidad and TobagoTunisiaTurkeyTurkmenistanTurks and Caicos IslandsUgandaUkraineUnited Arab EmiratesUnited KingdomUnited StatesUpper middle incomeUruguayUzbekistanVanuatuVenezuela, RBVietnamWest Bank and GazaWorldYemen, Rep.ZambiaZimbabwe Timeline:
This timeline shows a graph from 1961 to 2014 of Greenland. No data until 1960. Number of actual observations by date: 54.
Source name:
World Development Indicators
Source organization:
Carbon Dioxide Information Analysis Center, Environmental Sciences Division, Oak Ridge National Laboratory, Tennessee, United States.
Categories, topics:
Energy & Mining, Climate Change, Environment
Last updated:
apr 23, 2017
Indicators value changes by year
Minimum:
102.676
jan 1, 1961
Maximum:
722.399
jan 1, 1978
At the date of observation
Value
Absolute change
Change from previous value
jan 1, 1961
102.676
+102.676
0.0%
jan 1, 1962
176.016
+73.34
71.43%
jan 1, 1963
157.681
-18.335
-10.42%
jan 1, 1964
187.017
+29.336
18.6%
jan 1, 1965
223.687
+36.67
19.61%
jan 1, 1966
267.691
+44.004
19.67%
jan 1, 1967
282.359
+14.668
5.48%
jan 1, 1968
293.36
+11.001
3.9%
jan 1, 1969
440.04
+146.68
50.0%
jan 1, 1970
330.03
-110.01
-25.0%
jan 1, 1971
304.361
-25.669
-7.78%
jan 1, 1972
399.703
+95.342
31.33%
jan 1, 1973
535.382
+135.679
33.94%
jan 1, 1974
517.047
-18.335
-3.42%
jan 1, 1975
539.049
+22.002
4.26%
jan 1, 1976
506.046
-33.003
-6.12%
jan 1, 1977
209.019
-297.027
-58.7%
jan 1, 1978
722.399
+513.38
245.61%
jan 1, 1979
385.035
-337.364
-46.7%
jan 1, 1980
564.718
+179.683
46.67%
jan 1, 1981
557.384
-7.334
-1.3%
jan 1, 1982
520.714
-36.67
-6.58%
jan 1, 1983
513.38
-7.334
-1.41%
jan 1, 1984
359.366
-154.014
-30.0%
jan 1, 1985
564.718
+205.352
57.14%
jan 1, 1986
509.713
-55.005
-9.74%
jan 1, 1987
326.363
-183.35
-35.97%
jan 1, 1988
234.688
-91.675
-28.09%
jan 1, 1989
546.383
+311.695
132.81%
jan 1, 1990
473.043
-73.34
-13.42%
jan 1, 1991
553.717
+80.674
17.05%
jan 1, 1992
546.383
-7.334
-1.32%
jan 1, 1993
480.377
-66.006
-12.08%
jan 1, 1994
498.712
+18.335
3.82%
jan 1, 1995
502.379
+3.667
0.74%
jan 1, 1996
502.379
0.0
0.0%
jan 1, 1997
517.047
+14.668
2.92%
jan 1, 1998
520.714
+3.667
0.71%
jan 1, 1999
528.048
+7.334
1.41%
jan 1, 2000
539.049
+11.001
2.08%
jan 1, 2001
531.715
-7.334
-1.36%
jan 1, 2002
539.049
+7.334
1.38%
jan 1, 2003
539.049
0.0
0.0%
jan 1, 2004
531.715
-7.334
-1.36%
jan 1, 2005
583.053
+51.338
9.66%
jan 1, 2006
608.722
+25.669
4.4%
jan 1, 2007
627.057
+18.335
3.01%
jan 1, 2008
638.058
+11.001
1.75%
jan 1, 2009
660.06
+22.002
3.45%
jan 1, 2010
575.719
-84.341
-12.78%
jan 1, 2011
663.727
+88.008
15.29%
jan 1, 2012
707.731
+44.004
6.63%
jan 1, 2013
568.385
-139.346
-19.69%
jan 1, 2014
568.385
0.0
0.0%
Ranking of countries by current statistics by years


Comments: