29
/
en
AIzaSyAYiBZKx7MnpbEhh9jyipgxe19OcubqV5w
April 1, 2024
140115
Ghana
GHA
true
2
1
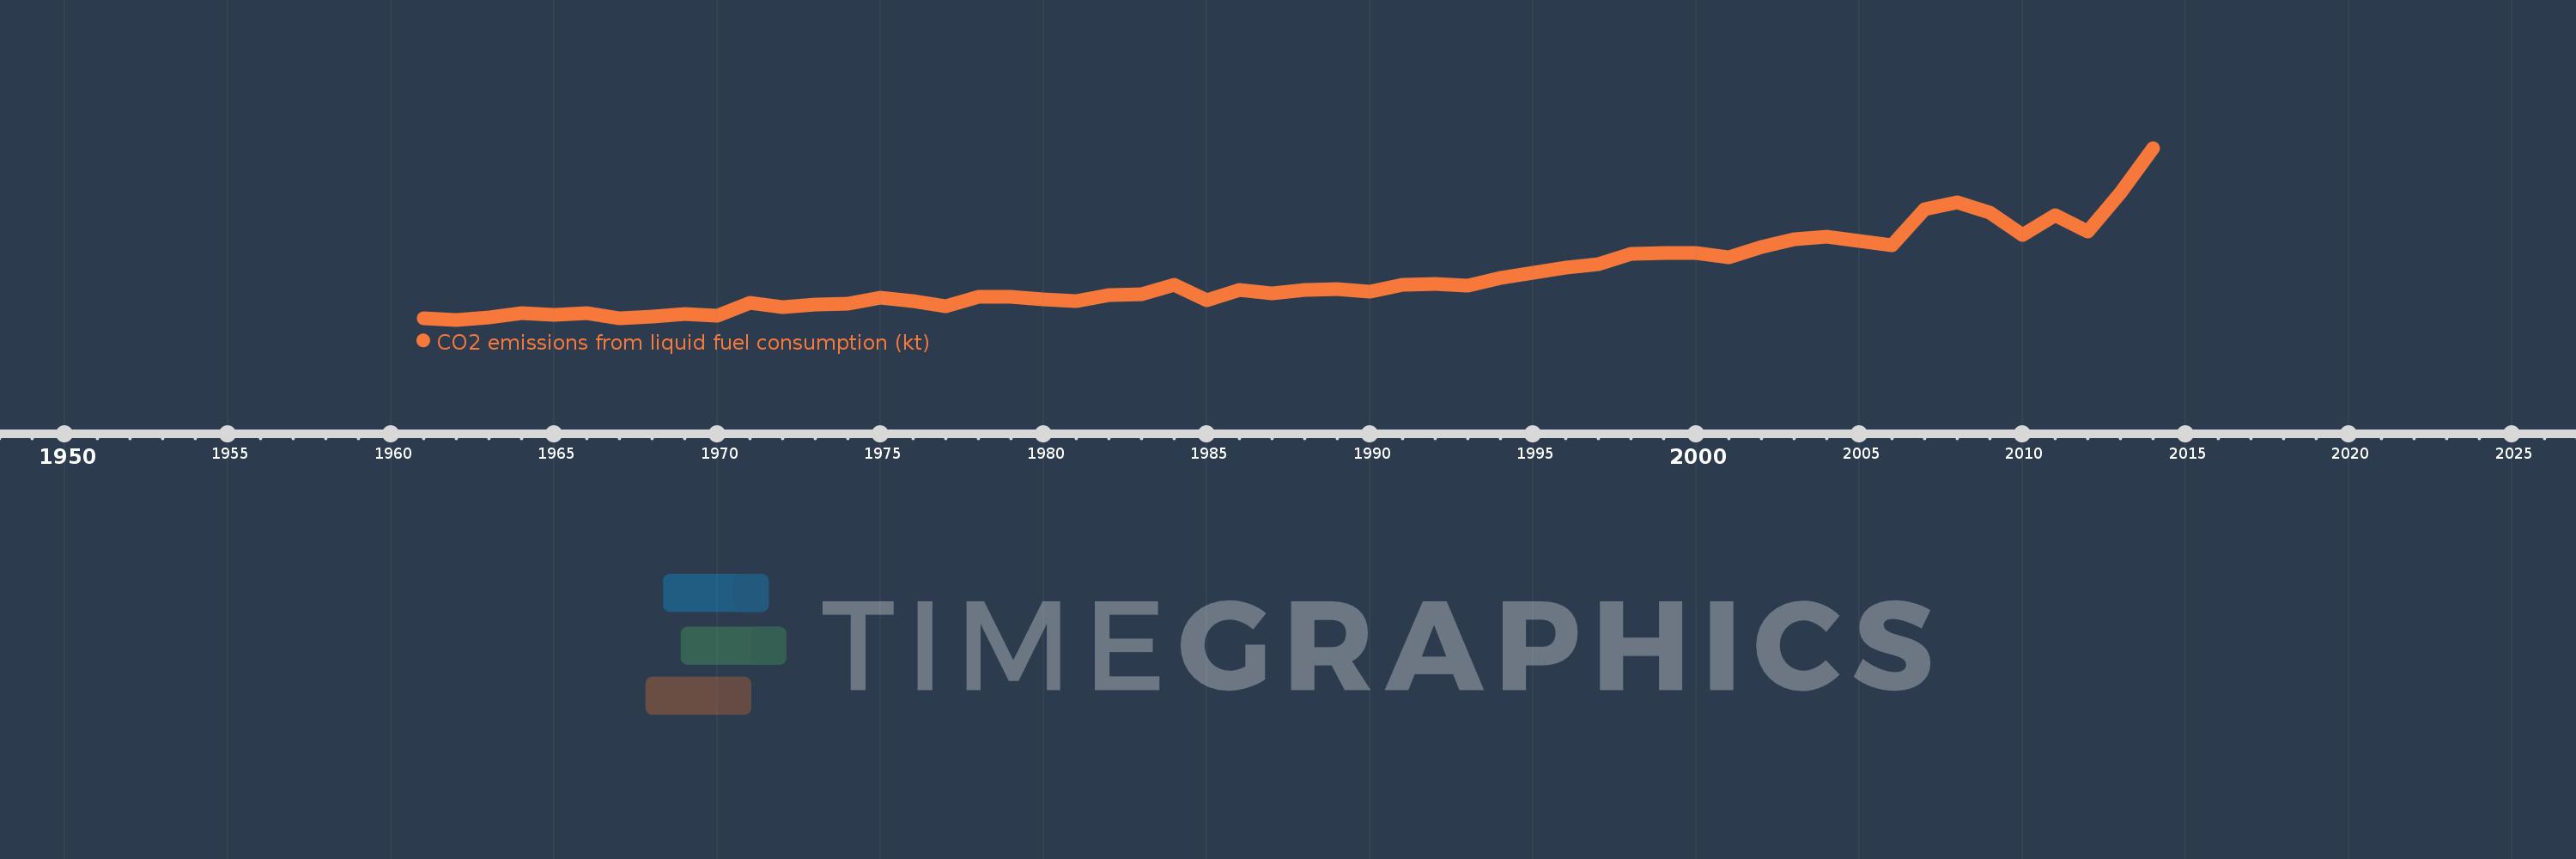
CO2 emissions from liquid fuel consumption (kt)
2014,2013,2012,2011,2010,2009,2008,2007,2006,2005,2004,2003,2002,2001,2000,1999,1998,1997,1996,1995,1994,1993,1992,1991,1990,1989,1988,1987,1986,1985,1984,1983,1982,1981,1980,1979,1978,1977,1976,1975,1974,1973,1972,1971,1970,1969,1968,1967,1966,1965,1964,1963,1962,1961
This statistics in other country:
AfghanistanAlbaniaAlgeriaAndorraAngolaAntigua and BarbudaArab WorldArgentinaArmeniaArubaAustraliaAustriaAzerbaijanBahamas, TheBahrainBangladeshBarbadosBelarusBelgiumBelizeBeninBermudaBhutanBoliviaBosnia and HerzegovinaBotswanaBrazilBritish Virgin IslandsBrunei DarussalamBulgariaBurkina FasoBurundiCabo VerdeCambodiaCameroonCanadaCaribbean small statesCayman IslandsCentral African RepublicCentral Europe and the BalticsChadChileChinaColombiaComorosCongo, Dem. Rep.Congo, Rep.Costa RicaCote d'IvoireCroatiaCubaCuracaoCyprusCzech RepublicDenmarkDjiboutiDominicaDominican RepublicEarly-demographic dividendEast Asia & PacificEast Asia & Pacific (excluding high income)East Asia & Pacific (IDA & IBRD countries)EcuadorEgypt, Arab Rep.El SalvadorEquatorial GuineaEritreaEstoniaEthiopiaEuro areaEurope & Central AsiaEurope & Central Asia (excluding high income)Europe & Central Asia (IDA & IBRD countries)European UnionFaroe IslandsFijiFinlandFragile and conflict affected situationsFranceFrench PolynesiaGabonGambia, TheGeorgiaGermanyGhanaGibraltarGreeceGreenlandGrenadaGuatemalaGuineaGuinea-BissauGuyanaHaitiHeavily indebted poor countries (HIPC)High incomeHondurasHong Kong SAR, ChinaHungaryIBRD onlyIcelandIDA & IBRD totalIDA blendIDA onlyIDA totalIndiaIndonesiaIran, Islamic Rep.IraqIrelandIsraelItalyJamaicaJapanJordanKazakhstanKenyaKiribatiKorea, Dem. People’s Rep.Korea, Rep.KuwaitKyrgyz RepublicLao PDRLate-demographic dividendLatin America & Caribbean Latin America & Caribbean (excluding high income)Latin America & the Caribbean (IDA & IBRD countries)LatviaLeast developed countries: UN classificationLebanonLesothoLiberiaLibyaLiechtensteinLithuaniaLow & middle incomeLow incomeLower middle incomeLuxembourgMacao SAR, ChinaMacedonia, FYRMadagascarMalawiMalaysiaMaldivesMaliMaltaMarshall IslandsMauritaniaMauritiusMexicoMicronesia, Fed. Sts.Middle East & North AfricaMiddle East & North Africa (excluding high income)Middle East & North Africa (IDA & IBRD countries)Middle incomeMoldovaMongoliaMontenegroMoroccoMozambiqueMyanmarNamibiaNauruNepalNetherlandsNew CaledoniaNew ZealandNicaraguaNigerNigeriaNorth AmericaNorwayOECD membersOmanOther small statesPacific island small statesPakistanPalauPanamaPapua New GuineaParaguayPeruPhilippinesPolandPortugalPost-demographic dividendPre-demographic dividendQatarRomaniaRussian FederationRwandaSamoaSao Tome and PrincipeSaudi ArabiaSenegalSerbiaSeychellesSierra LeoneSingaporeSint Maarten (Dutch part)Slovak RepublicSloveniaSmall statesSolomon IslandsSomaliaSouth AfricaSouth AsiaSouth Asia (IDA & IBRD)South SudanSpainSri LankaSt. Kitts and NevisSt. LuciaSt. Vincent and the GrenadinesSub-Saharan Africa Sub-Saharan Africa (excluding high income)Sub-Saharan Africa (IDA & IBRD countries)SudanSurinameSwazilandSwedenSwitzerlandSyrian Arab RepublicTajikistanTanzaniaThailandTimor-LesteTogoTongaTrinidad and TobagoTunisiaTurkeyTurkmenistanTurks and Caicos IslandsUgandaUkraineUnited Arab EmiratesUnited KingdomUnited StatesUpper middle incomeUruguayUzbekistanVanuatuVenezuela, RBVietnamWest Bank and GazaWorldYemen, Rep.ZambiaZimbabwe Timeline:
This timeline shows a graph from 1961 to 2014 of Ghana. No data until 1960. Number of actual observations by date: 54.
Source name:
World Development Indicators
Source organization:
Carbon Dioxide Information Analysis Center, Environmental Sciences Division, Oak Ridge National Laboratory, Tennessee, United States.
Categories, topics:
Energy & Mining, Climate Change, Environment
Last updated:
apr 23, 2017
Indicators value changes by year
Minimum:
1.192K
jan 1, 1962
Maximum:
12.523K
jan 1, 2014
At the date of observation
Value
Absolute change
Change from previous value
jan 1, 1961
1.298K
+1.298K
0.0%
jan 1, 1962
1.192K
-106.343
-8.19%
jan 1, 1963
1.346K
+154.014
12.92%
jan 1, 1964
1.61K
+264.024
19.62%
jan 1, 1965
1.533K
-77.007
-4.78%
jan 1, 1966
1.632K
+99.009
6.46%
jan 1, 1967
1.298K
-333.697
-20.45%
jan 1, 1968
1.419K
+121.011
9.32%
jan 1, 1969
1.588K
+168.682
11.89%
jan 1, 1970
1.441K
-146.68
-9.24%
jan 1, 1971
2.321K
+880.08
61.07%
jan 1, 1972
2.017K
-304.361
-13.11%
jan 1, 1973
2.204K
+187.017
9.27%
jan 1, 1974
2.23K
+25.669
1.16%
jan 1, 1975
2.67K
+440.04
19.74%
jan 1, 1976
2.398K
-271.358
-10.16%
jan 1, 1977
2.079K
-319.029
-13.3%
jan 1, 1978
2.692K
+612.389
29.45%
jan 1, 1979
2.714K
+22.002
0.82%
jan 1, 1980
2.519K
-194.351
-7.16%
jan 1, 1981
2.406K
-113.677
-4.51%
jan 1, 1982
2.842K
+436.373
18.14%
jan 1, 1983
2.893K
+51.338
1.81%
jan 1, 1984
3.506K
+612.389
21.17%
jan 1, 1985
2.461K
-1.045K
-29.81%
jan 1, 1986
3.143K
+682.062
27.72%
jan 1, 1987
2.934K
-209.019
-6.65%
jan 1, 1988
3.143K
+209.019
7.13%
jan 1, 1989
3.205K
+62.339
1.98%
jan 1, 1990
3.055K
-150.347
-4.69%
jan 1, 1991
3.473K
+418.038
13.69%
jan 1, 1992
3.553K
+80.674
2.32%
jan 1, 1993
3.462K
-91.675
-2.58%
jan 1, 1994
3.935K
+473.043
13.67%
jan 1, 1995
4.272K
+337.364
8.57%
jan 1, 1996
4.62K
+348.365
8.15%
jan 1, 1997
4.855K
+234.688
5.08%
jan 1, 1998
5.512K
+656.393
13.52%
jan 1, 1999
5.589K
+77.007
1.4%
jan 1, 2000
5.618K
+29.336
0.52%
jan 1, 2001
5.317K
-300.694
-5.35%
jan 1, 2002
5.974K
+656.393
12.34%
jan 1, 2003
6.476K
+502.379
8.41%
jan 1, 2004
6.685K
+209.019
3.23%
jan 1, 2005
6.403K
-282.359
-4.22%
jan 1, 2006
6.095K
-308.028
-4.81%
jan 1, 2007
8.46K
+2.365K
38.81%
jan 1, 2008
8.929K
+469.376
5.55%
jan 1, 2009
8.24K
-689.396
-7.72%
jan 1, 2010
6.802K
-1.437K
-17.45%
jan 1, 2011
8.097K
+1.294K
19.03%
jan 1, 2012
7.0K
-1.096K
-13.54%
jan 1, 2013
9.575K
+2.574K
36.77%
jan 1, 2014
12.523K
+2.948K
30.79%
Ranking of countries by current statistics by years


Comments: