29
/
en
AIzaSyAYiBZKx7MnpbEhh9jyipgxe19OcubqV5w
April 1, 2024
235489
Senegal
SEN
true
2
1
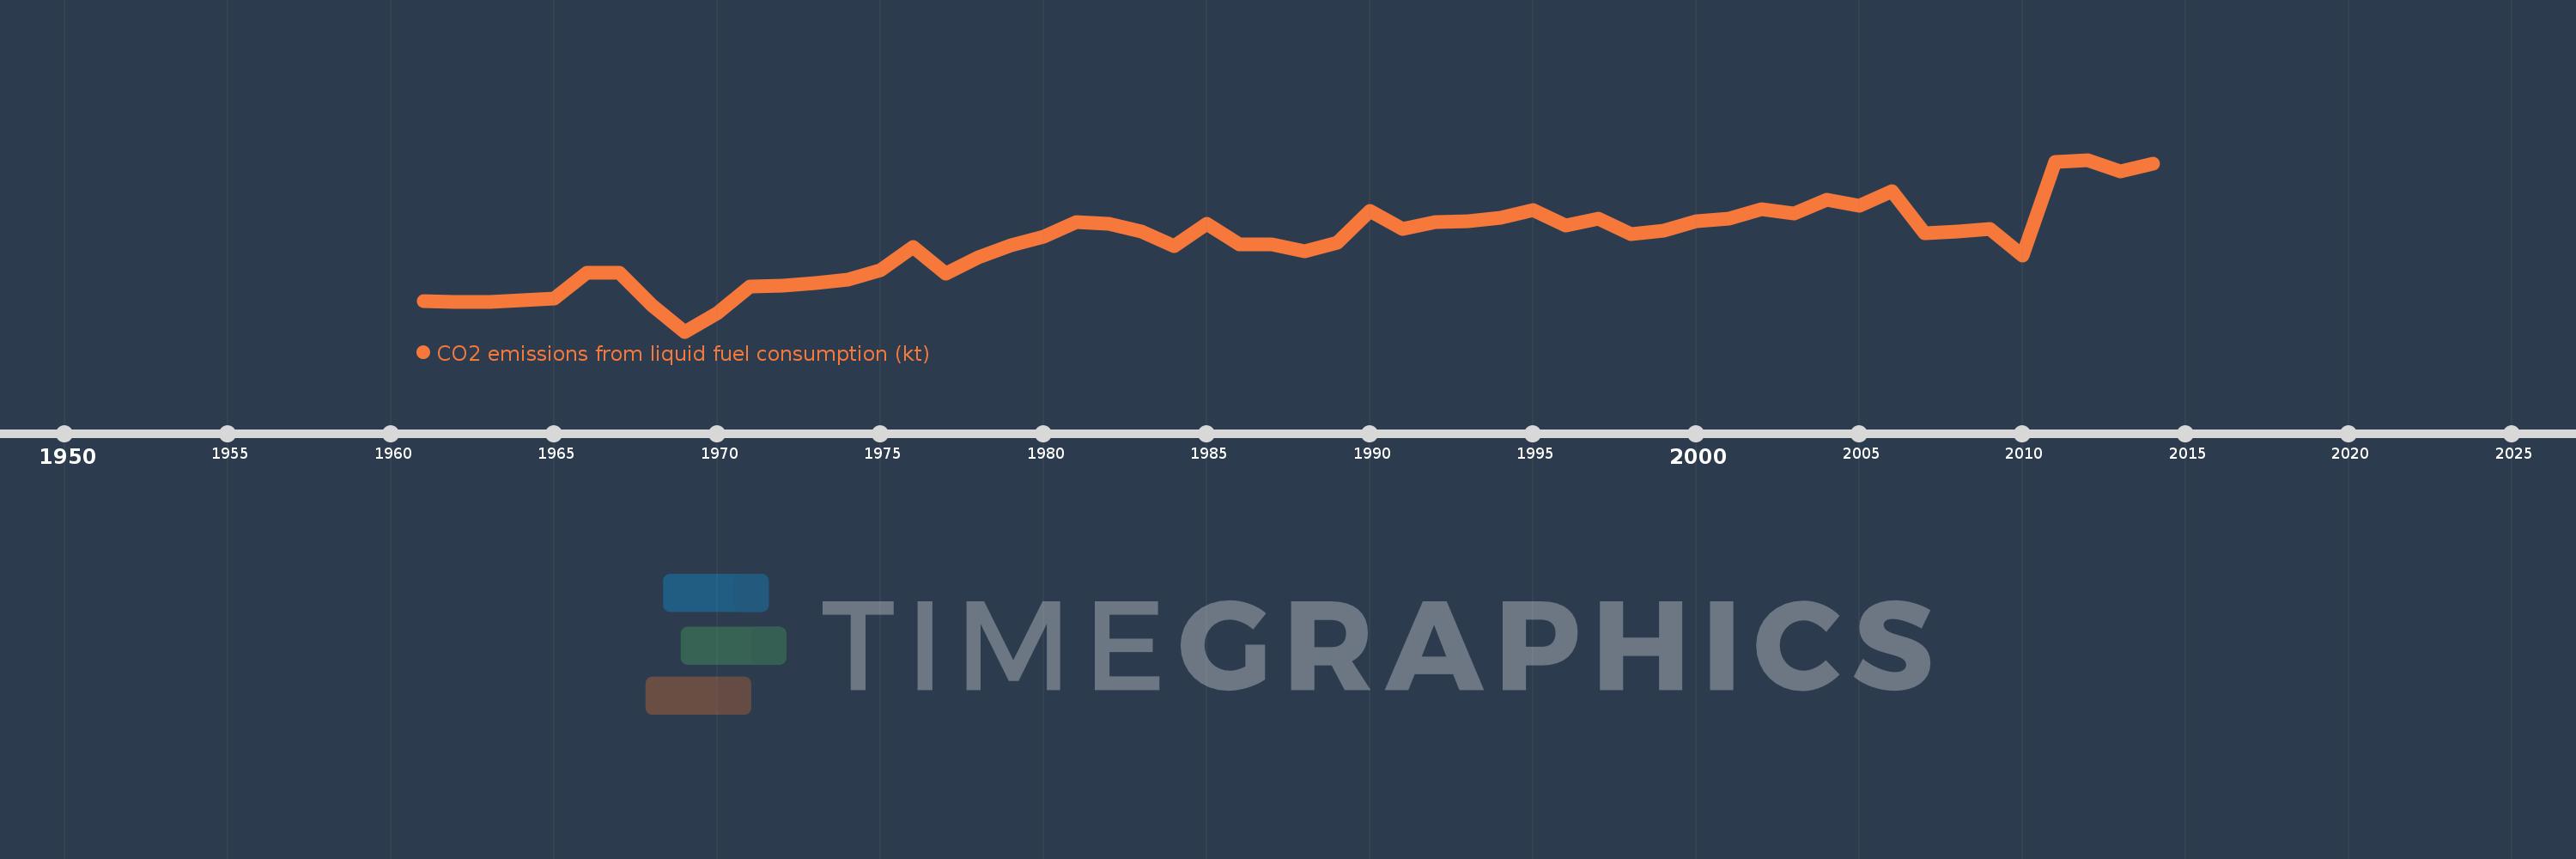
CO2 emissions from liquid fuel consumption (kt)
2014,2013,2012,2011,2010,2009,2008,2007,2006,2005,2004,2003,2002,2001,2000,1999,1998,1997,1996,1995,1994,1993,1992,1991,1990,1989,1988,1987,1986,1985,1984,1983,1982,1981,1980,1979,1978,1977,1976,1975,1974,1973,1972,1971,1970,1969,1968,1967,1966,1965,1964,1963,1962,1961
This statistics in other country:
AfghanistanAlbaniaAlgeriaAndorraAngolaAntigua and BarbudaArab WorldArgentinaArmeniaArubaAustraliaAustriaAzerbaijanBahamas, TheBahrainBangladeshBarbadosBelarusBelgiumBelizeBeninBermudaBhutanBoliviaBosnia and HerzegovinaBotswanaBrazilBritish Virgin IslandsBrunei DarussalamBulgariaBurkina FasoBurundiCabo VerdeCambodiaCameroonCanadaCaribbean small statesCayman IslandsCentral African RepublicCentral Europe and the BalticsChadChileChinaColombiaComorosCongo, Dem. Rep.Congo, Rep.Costa RicaCote d'IvoireCroatiaCubaCuracaoCyprusCzech RepublicDenmarkDjiboutiDominicaDominican RepublicEarly-demographic dividendEast Asia & PacificEast Asia & Pacific (excluding high income)East Asia & Pacific (IDA & IBRD countries)EcuadorEgypt, Arab Rep.El SalvadorEquatorial GuineaEritreaEstoniaEthiopiaEuro areaEurope & Central AsiaEurope & Central Asia (excluding high income)Europe & Central Asia (IDA & IBRD countries)European UnionFaroe IslandsFijiFinlandFragile and conflict affected situationsFranceFrench PolynesiaGabonGambia, TheGeorgiaGermanyGhanaGibraltarGreeceGreenlandGrenadaGuatemalaGuineaGuinea-BissauGuyanaHaitiHeavily indebted poor countries (HIPC)High incomeHondurasHong Kong SAR, ChinaHungaryIBRD onlyIcelandIDA & IBRD totalIDA blendIDA onlyIDA totalIndiaIndonesiaIran, Islamic Rep.IraqIrelandIsraelItalyJamaicaJapanJordanKazakhstanKenyaKiribatiKorea, Dem. People’s Rep.Korea, Rep.KuwaitKyrgyz RepublicLao PDRLate-demographic dividendLatin America & Caribbean Latin America & Caribbean (excluding high income)Latin America & the Caribbean (IDA & IBRD countries)LatviaLeast developed countries: UN classificationLebanonLesothoLiberiaLibyaLiechtensteinLithuaniaLow & middle incomeLow incomeLower middle incomeLuxembourgMacao SAR, ChinaMacedonia, FYRMadagascarMalawiMalaysiaMaldivesMaliMaltaMarshall IslandsMauritaniaMauritiusMexicoMicronesia, Fed. Sts.Middle East & North AfricaMiddle East & North Africa (excluding high income)Middle East & North Africa (IDA & IBRD countries)Middle incomeMoldovaMongoliaMontenegroMoroccoMozambiqueMyanmarNamibiaNauruNepalNetherlandsNew CaledoniaNew ZealandNicaraguaNigerNigeriaNorth AmericaNorwayOECD membersOmanOther small statesPacific island small statesPakistanPalauPanamaPapua New GuineaParaguayPeruPhilippinesPolandPortugalPost-demographic dividendPre-demographic dividendQatarRomaniaRussian FederationRwandaSamoaSao Tome and PrincipeSaudi ArabiaSenegalSerbiaSeychellesSierra LeoneSingaporeSint Maarten (Dutch part)Slovak RepublicSloveniaSmall statesSolomon IslandsSomaliaSouth AfricaSouth AsiaSouth Asia (IDA & IBRD)South SudanSpainSri LankaSt. Kitts and NevisSt. LuciaSt. Vincent and the GrenadinesSub-Saharan Africa Sub-Saharan Africa (excluding high income)Sub-Saharan Africa (IDA & IBRD countries)SudanSurinameSwazilandSwedenSwitzerlandSyrian Arab RepublicTajikistanTanzaniaThailandTimor-LesteTogoTongaTrinidad and TobagoTunisiaTurkeyTurkmenistanTurks and Caicos IslandsUgandaUkraineUnited Arab EmiratesUnited KingdomUnited StatesUpper middle incomeUruguayUzbekistanVanuatuVenezuela, RBVietnamWest Bank and GazaWorldYemen, Rep.ZambiaZimbabwe Timeline:
This timeline shows a graph from 1961 to 2014 of Senegal. No data until 1960. Number of actual observations by date: 54.
Source name:
World Development Indicators
Source organization:
Carbon Dioxide Information Analysis Center, Environmental Sciences Division, Oak Ridge National Laboratory, Tennessee, United States.
Categories, topics:
Energy & Mining, Climate Change, Environment
Last updated:
apr 23, 2017
Indicators value changes by year
Minimum:
-179.683
jan 1, 1969
Maximum:
5.053K
jan 1, 2012
At the date of observation
Value
Absolute change
Change from previous value
jan 1, 1961
744.401
+744.401
0.0%
jan 1, 1962
722.399
-22.002
-2.96%
jan 1, 1963
722.399
0.0
0.0%
jan 1, 1964
766.403
+44.004
6.09%
jan 1, 1965
821.408
+55.005
7.18%
jan 1, 1966
1.602K
+781.071
95.09%
jan 1, 1967
1.624K
+22.002
1.37%
jan 1, 1968
616.056
-1.008K
-62.08%
jan 1, 1969
-179.683
-795.739
-129.17%
jan 1, 1970
388.702
+568.385
-316.33%
jan 1, 1971
1.188K
+799.406
205.66%
jan 1, 1972
1.232K
+44.004
3.7%
jan 1, 1973
1.287K
+55.005
4.46%
jan 1, 1974
1.404K
+117.344
9.12%
jan 1, 1975
1.687K
+282.359
20.1%
jan 1, 1976
2.402K
+715.065
42.39%
jan 1, 1977
1.584K
-817.741
-34.05%
jan 1, 1978
2.079K
+495.045
31.25%
jan 1, 1979
2.45K
+370.367
17.81%
jan 1, 1980
2.71K
+260.357
10.63%
jan 1, 1981
3.157K
+447.374
16.51%
jan 1, 1982
3.11K
-47.671
-1.51%
jan 1, 1983
2.875K
-234.688
-7.55%
jan 1, 1984
2.435K
-440.04
-15.31%
jan 1, 1985
3.117K
+682.062
28.01%
jan 1, 1986
2.475K
-641.725
-20.59%
jan 1, 1987
2.479K
+3.667
0.15%
jan 1, 1988
2.266K
-212.686
-8.58%
jan 1, 1989
2.534K
+267.691
11.81%
jan 1, 1990
3.491K
+957.087
37.77%
jan 1, 1991
2.937K
-553.717
-15.86%
jan 1, 1992
3.168K
+231.021
7.87%
jan 1, 1993
3.176K
+7.334
0.23%
jan 1, 1994
3.275K
+99.009
3.12%
jan 1, 1995
3.52K
+245.689
7.5%
jan 1, 1996
3.058K
-462.042
-13.13%
jan 1, 1997
3.253K
+194.351
6.35%
jan 1, 1998
2.791K
-462.042
-14.21%
jan 1, 1999
2.893K
+102.676
3.68%
jan 1, 2000
3.19K
+297.027
10.27%
jan 1, 2001
3.271K
+80.674
2.53%
jan 1, 2002
3.561K
+289.693
8.86%
jan 1, 2003
3.41K
-150.347
-4.22%
jan 1, 2004
3.828K
+418.038
12.26%
jan 1, 2005
3.645K
-183.35
-4.79%
jan 1, 2006
4.107K
+462.042
12.68%
jan 1, 2007
2.824K
-1.283K
-31.25%
jan 1, 2008
2.879K
+55.005
1.95%
jan 1, 2009
2.937K
+58.672
2.04%
jan 1, 2010
2.149K
-788.405
-26.84%
jan 1, 2011
4.994K
+2.846K
132.42%
jan 1, 2012
5.053K
+58.672
1.17%
jan 1, 2013
4.701K
-352.032
-6.97%
jan 1, 2014
4.936K
+234.688
4.99%
Ranking of countries by current statistics by years


Comments: