29
/
en
AIzaSyAYiBZKx7MnpbEhh9jyipgxe19OcubqV5w
April 1, 2024
230796
Rwanda
RWA
true
2
1
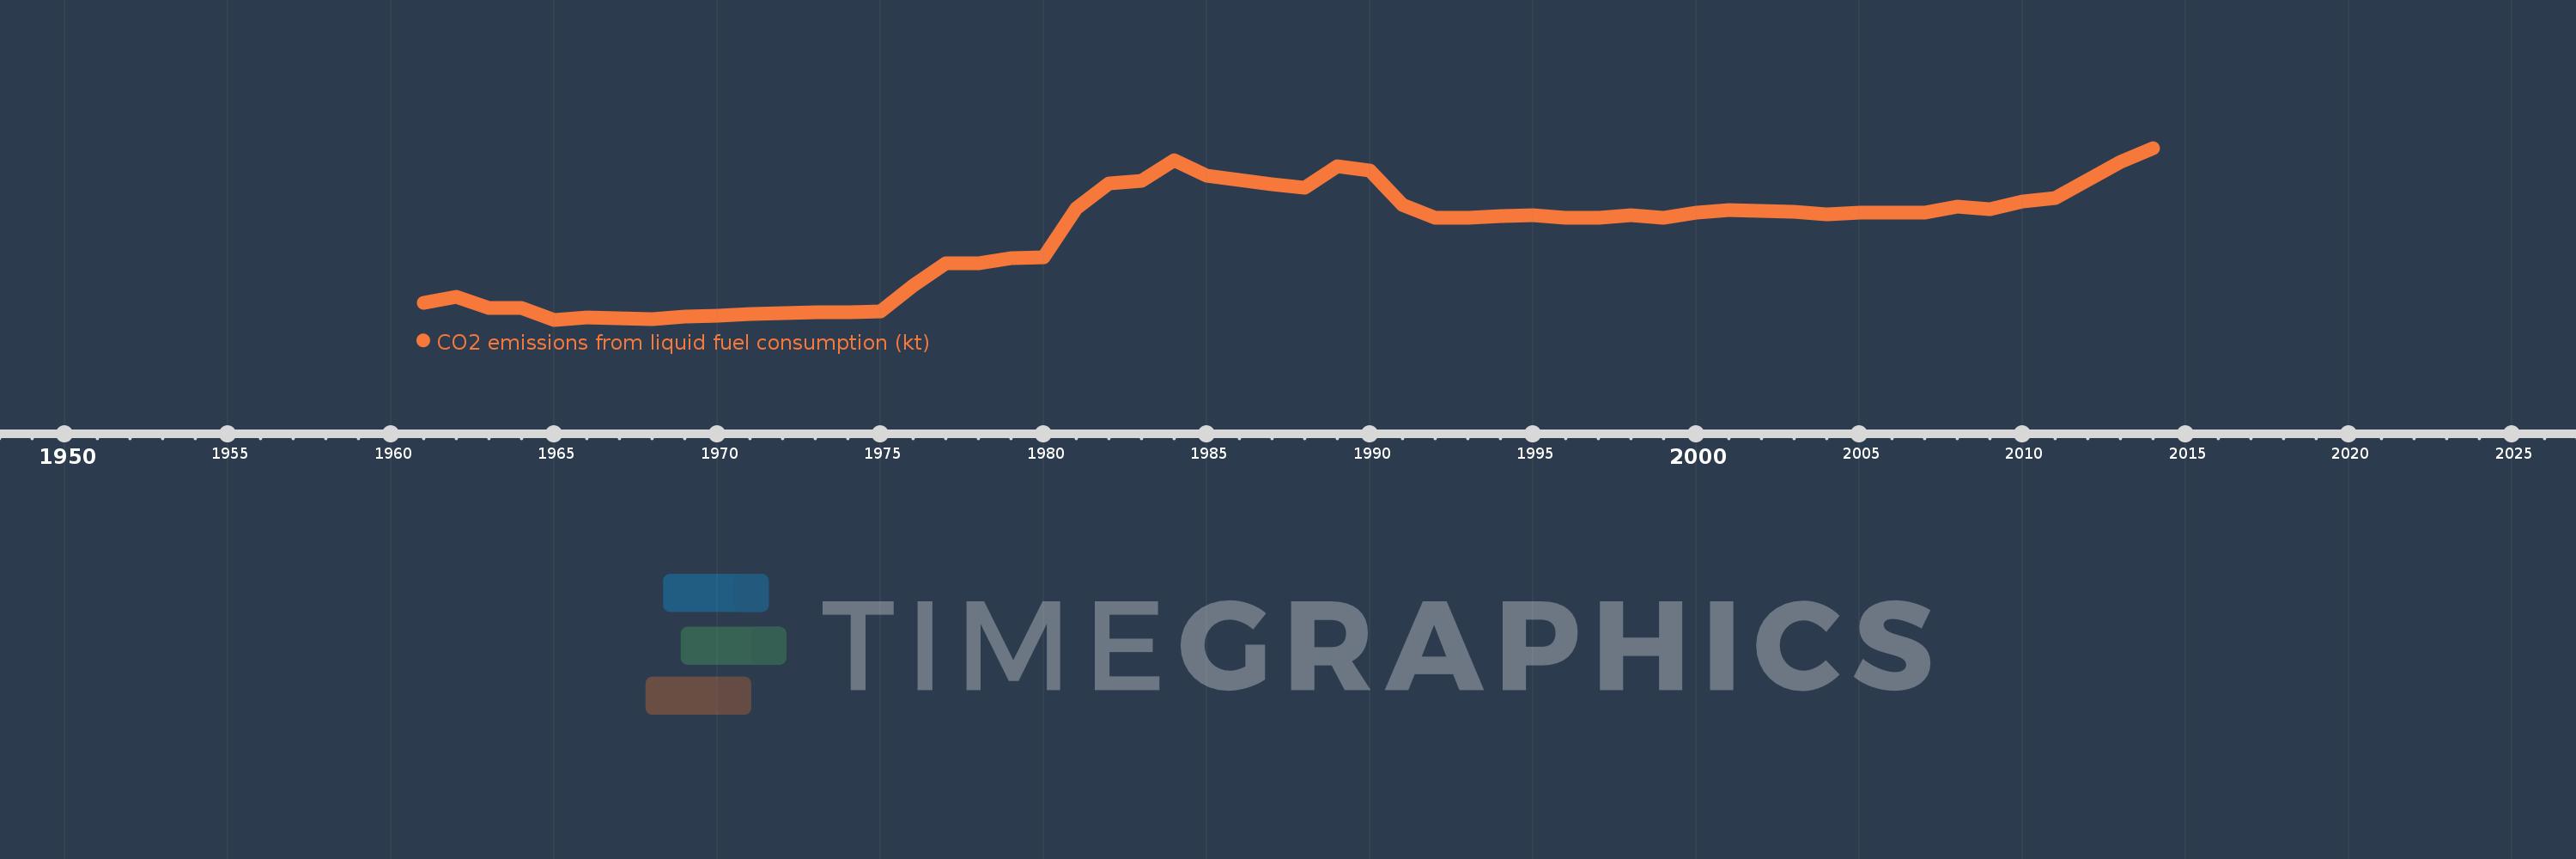
CO2 emissions from liquid fuel consumption (kt)
2014,2013,2012,2011,2010,2009,2008,2007,2006,2005,2004,2003,2002,2001,2000,1999,1998,1997,1996,1995,1994,1993,1992,1991,1990,1989,1988,1987,1986,1985,1984,1983,1982,1981,1980,1979,1978,1977,1976,1975,1974,1973,1972,1971,1970,1969,1968,1967,1966,1965,1964,1963,1962,1961
This statistics in other country:
AfghanistanAlbaniaAlgeriaAndorraAngolaAntigua and BarbudaArab WorldArgentinaArmeniaArubaAustraliaAustriaAzerbaijanBahamas, TheBahrainBangladeshBarbadosBelarusBelgiumBelizeBeninBermudaBhutanBoliviaBosnia and HerzegovinaBotswanaBrazilBritish Virgin IslandsBrunei DarussalamBulgariaBurkina FasoBurundiCabo VerdeCambodiaCameroonCanadaCaribbean small statesCayman IslandsCentral African RepublicCentral Europe and the BalticsChadChileChinaColombiaComorosCongo, Dem. Rep.Congo, Rep.Costa RicaCote d'IvoireCroatiaCubaCuracaoCyprusCzech RepublicDenmarkDjiboutiDominicaDominican RepublicEarly-demographic dividendEast Asia & PacificEast Asia & Pacific (excluding high income)East Asia & Pacific (IDA & IBRD countries)EcuadorEgypt, Arab Rep.El SalvadorEquatorial GuineaEritreaEstoniaEthiopiaEuro areaEurope & Central AsiaEurope & Central Asia (excluding high income)Europe & Central Asia (IDA & IBRD countries)European UnionFaroe IslandsFijiFinlandFragile and conflict affected situationsFranceFrench PolynesiaGabonGambia, TheGeorgiaGermanyGhanaGibraltarGreeceGreenlandGrenadaGuatemalaGuineaGuinea-BissauGuyanaHaitiHeavily indebted poor countries (HIPC)High incomeHondurasHong Kong SAR, ChinaHungaryIBRD onlyIcelandIDA & IBRD totalIDA blendIDA onlyIDA totalIndiaIndonesiaIran, Islamic Rep.IraqIrelandIsraelItalyJamaicaJapanJordanKazakhstanKenyaKiribatiKorea, Dem. People’s Rep.Korea, Rep.KuwaitKyrgyz RepublicLao PDRLate-demographic dividendLatin America & Caribbean Latin America & Caribbean (excluding high income)Latin America & the Caribbean (IDA & IBRD countries)LatviaLeast developed countries: UN classificationLebanonLesothoLiberiaLibyaLiechtensteinLithuaniaLow & middle incomeLow incomeLower middle incomeLuxembourgMacao SAR, ChinaMacedonia, FYRMadagascarMalawiMalaysiaMaldivesMaliMaltaMarshall IslandsMauritaniaMauritiusMexicoMicronesia, Fed. Sts.Middle East & North AfricaMiddle East & North Africa (excluding high income)Middle East & North Africa (IDA & IBRD countries)Middle incomeMoldovaMongoliaMontenegroMoroccoMozambiqueMyanmarNamibiaNauruNepalNetherlandsNew CaledoniaNew ZealandNicaraguaNigerNigeriaNorth AmericaNorwayOECD membersOmanOther small statesPacific island small statesPakistanPalauPanamaPapua New GuineaParaguayPeruPhilippinesPolandPortugalPost-demographic dividendPre-demographic dividendQatarRomaniaRussian FederationRwandaSamoaSao Tome and PrincipeSaudi ArabiaSenegalSerbiaSeychellesSierra LeoneSingaporeSint Maarten (Dutch part)Slovak RepublicSloveniaSmall statesSolomon IslandsSomaliaSouth AfricaSouth AsiaSouth Asia (IDA & IBRD)South SudanSpainSri LankaSt. Kitts and NevisSt. LuciaSt. Vincent and the GrenadinesSub-Saharan Africa Sub-Saharan Africa (excluding high income)Sub-Saharan Africa (IDA & IBRD countries)SudanSurinameSwazilandSwedenSwitzerlandSyrian Arab RepublicTajikistanTanzaniaThailandTimor-LesteTogoTongaTrinidad and TobagoTunisiaTurkeyTurkmenistanTurks and Caicos IslandsUgandaUkraineUnited Arab EmiratesUnited KingdomUnited StatesUpper middle incomeUruguayUzbekistanVanuatuVenezuela, RBVietnamWest Bank and GazaWorldYemen, Rep.ZambiaZimbabwe Timeline:
This timeline shows a graph from 1961 to 2014 of Rwanda. No data until 1960. Number of actual observations by date: 54.
Source name:
World Development Indicators
Source organization:
Carbon Dioxide Information Analysis Center, Environmental Sciences Division, Oak Ridge National Laboratory, Tennessee, United States.
Categories, topics:
Energy & Mining, Climate Change, Environment
Last updated:
apr 23, 2017
Indicators value changes by year
Maximum:
744.401
jan 1, 2014
At the date of observation
Value
Absolute change
Change from previous value
jan 1, 1961
106.343
+106.343
0.0%
jan 1, 1962
132.012
+25.669
24.14%
jan 1, 1963
84.341
-47.671
-36.11%
jan 1, 1964
84.341
0.0
0.0%
jan 1, 1965
36.67
-47.671
-56.52%
jan 1, 1966
47.671
+11.001
30.0%
jan 1, 1967
44.004
-3.667
-7.69%
jan 1, 1968
40.337
-3.667
-8.33%
jan 1, 1969
51.338
+11.001
27.27%
jan 1, 1970
55.005
+3.667
7.14%
jan 1, 1971
58.672
+3.667
6.67%
jan 1, 1972
62.339
+3.667
6.25%
jan 1, 1973
66.006
+3.667
5.88%
jan 1, 1974
66.006
0.0
0.0%
jan 1, 1975
69.673
+3.667
5.56%
jan 1, 1976
176.016
+106.343
152.63%
jan 1, 1977
267.691
+91.675
52.08%
jan 1, 1978
267.691
0.0
0.0%
jan 1, 1979
289.693
+22.002
8.22%
jan 1, 1980
293.36
+3.667
1.27%
jan 1, 1981
495.045
+201.685
68.75%
jan 1, 1982
597.721
+102.676
20.74%
jan 1, 1983
608.722
+11.001
1.84%
jan 1, 1984
693.063
+84.341
13.86%
jan 1, 1985
630.724
-62.339
-8.99%
jan 1, 1986
612.389
-18.335
-2.91%
jan 1, 1987
594.054
-18.335
-2.99%
jan 1, 1988
579.386
-14.668
-2.47%
jan 1, 1989
667.394
+88.008
15.19%
jan 1, 1990
652.726
-14.668
-2.2%
jan 1, 1991
509.713
-143.013
-21.91%
jan 1, 1992
458.375
-51.338
-10.07%
jan 1, 1993
458.375
0.0
0.0%
jan 1, 1994
462.042
+3.667
0.8%
jan 1, 1995
465.709
+3.667
0.79%
jan 1, 1996
458.375
-7.334
-1.57%
jan 1, 1997
458.375
0.0
0.0%
jan 1, 1998
465.709
+7.334
1.6%
jan 1, 1999
458.375
-7.334
-1.57%
jan 1, 2000
476.71
+18.335
4.0%
jan 1, 2001
487.711
+11.001
2.31%
jan 1, 2002
484.044
-3.667
-0.75%
jan 1, 2003
480.377
-3.667
-0.76%
jan 1, 2004
469.376
-11.001
-2.29%
jan 1, 2005
476.71
+7.334
1.56%
jan 1, 2006
476.71
0.0
0.0%
jan 1, 2007
476.71
0.0
0.0%
jan 1, 2008
502.379
+25.669
5.38%
jan 1, 2009
491.378
-11.001
-2.19%
jan 1, 2010
524.381
+33.003
6.72%
jan 1, 2011
539.049
+14.668
2.8%
jan 1, 2012
612.389
+73.34
13.61%
jan 1, 2013
685.729
+73.34
11.98%
jan 1, 2014
744.401
+58.672
8.56%
Ranking of countries by current statistics by years


Comments: