29
/
en
AIzaSyAYiBZKx7MnpbEhh9jyipgxe19OcubqV5w
April 1, 2024
212724
Nigeria
NGA
true
2
1
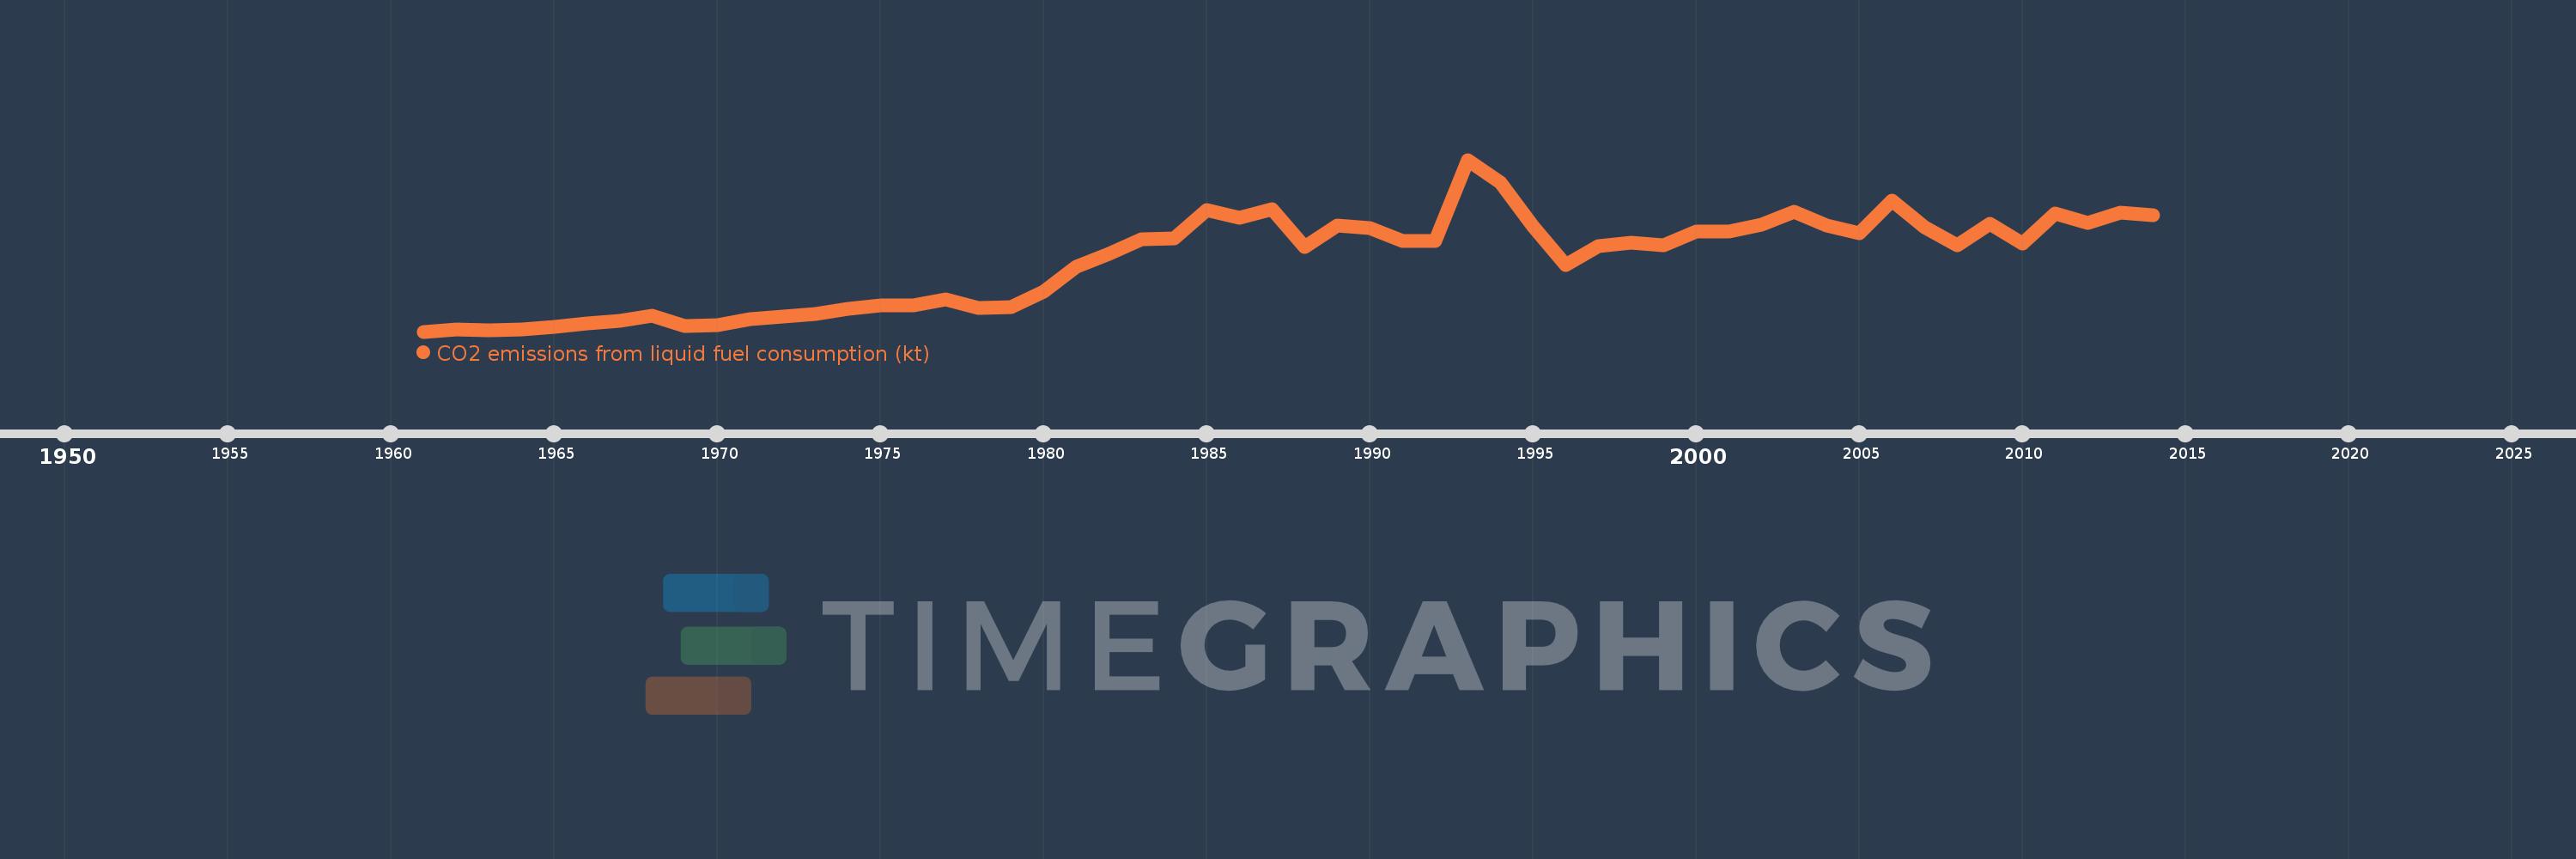
CO2 emissions from liquid fuel consumption (kt)
2014,2013,2012,2011,2010,2009,2008,2007,2006,2005,2004,2003,2002,2001,2000,1999,1998,1997,1996,1995,1994,1993,1992,1991,1990,1989,1988,1987,1986,1985,1984,1983,1982,1981,1980,1979,1978,1977,1976,1975,1974,1973,1972,1971,1970,1969,1968,1967,1966,1965,1964,1963,1962,1961
This statistics in other country:
AfghanistanAlbaniaAlgeriaAndorraAngolaAntigua and BarbudaArab WorldArgentinaArmeniaArubaAustraliaAustriaAzerbaijanBahamas, TheBahrainBangladeshBarbadosBelarusBelgiumBelizeBeninBermudaBhutanBoliviaBosnia and HerzegovinaBotswanaBrazilBritish Virgin IslandsBrunei DarussalamBulgariaBurkina FasoBurundiCabo VerdeCambodiaCameroonCanadaCaribbean small statesCayman IslandsCentral African RepublicCentral Europe and the BalticsChadChileChinaColombiaComorosCongo, Dem. Rep.Congo, Rep.Costa RicaCote d'IvoireCroatiaCubaCuracaoCyprusCzech RepublicDenmarkDjiboutiDominicaDominican RepublicEarly-demographic dividendEast Asia & PacificEast Asia & Pacific (excluding high income)East Asia & Pacific (IDA & IBRD countries)EcuadorEgypt, Arab Rep.El SalvadorEquatorial GuineaEritreaEstoniaEthiopiaEuro areaEurope & Central AsiaEurope & Central Asia (excluding high income)Europe & Central Asia (IDA & IBRD countries)European UnionFaroe IslandsFijiFinlandFragile and conflict affected situationsFranceFrench PolynesiaGabonGambia, TheGeorgiaGermanyGhanaGibraltarGreeceGreenlandGrenadaGuatemalaGuineaGuinea-BissauGuyanaHaitiHeavily indebted poor countries (HIPC)High incomeHondurasHong Kong SAR, ChinaHungaryIBRD onlyIcelandIDA & IBRD totalIDA blendIDA onlyIDA totalIndiaIndonesiaIran, Islamic Rep.IraqIrelandIsraelItalyJamaicaJapanJordanKazakhstanKenyaKiribatiKorea, Dem. People’s Rep.Korea, Rep.KuwaitKyrgyz RepublicLao PDRLate-demographic dividendLatin America & Caribbean Latin America & Caribbean (excluding high income)Latin America & the Caribbean (IDA & IBRD countries)LatviaLeast developed countries: UN classificationLebanonLesothoLiberiaLibyaLiechtensteinLithuaniaLow & middle incomeLow incomeLower middle incomeLuxembourgMacao SAR, ChinaMacedonia, FYRMadagascarMalawiMalaysiaMaldivesMaliMaltaMarshall IslandsMauritaniaMauritiusMexicoMicronesia, Fed. Sts.Middle East & North AfricaMiddle East & North Africa (excluding high income)Middle East & North Africa (IDA & IBRD countries)Middle incomeMoldovaMongoliaMontenegroMoroccoMozambiqueMyanmarNamibiaNauruNepalNetherlandsNew CaledoniaNew ZealandNicaraguaNigerNigeriaNorth AmericaNorwayOECD membersOmanOther small statesPacific island small statesPakistanPalauPanamaPapua New GuineaParaguayPeruPhilippinesPolandPortugalPost-demographic dividendPre-demographic dividendQatarRomaniaRussian FederationRwandaSamoaSao Tome and PrincipeSaudi ArabiaSenegalSerbiaSeychellesSierra LeoneSingaporeSint Maarten (Dutch part)Slovak RepublicSloveniaSmall statesSolomon IslandsSomaliaSouth AfricaSouth AsiaSouth Asia (IDA & IBRD)South SudanSpainSri LankaSt. Kitts and NevisSt. LuciaSt. Vincent and the GrenadinesSub-Saharan Africa Sub-Saharan Africa (excluding high income)Sub-Saharan Africa (IDA & IBRD countries)SudanSurinameSwazilandSwedenSwitzerlandSyrian Arab RepublicTajikistanTanzaniaThailandTimor-LesteTogoTongaTrinidad and TobagoTunisiaTurkeyTurkmenistanTurks and Caicos IslandsUgandaUkraineUnited Arab EmiratesUnited KingdomUnited StatesUpper middle incomeUruguayUzbekistanVanuatuVenezuela, RBVietnamWest Bank and GazaWorldYemen, Rep.ZambiaZimbabwe Timeline:
This timeline shows a graph from 1961 to 2014 of Nigeria. No data until 1960. Number of actual observations by date: 54.
Source name:
World Development Indicators
Source organization:
Carbon Dioxide Information Analysis Center, Environmental Sciences Division, Oak Ridge National Laboratory, Tennessee, United States.
Categories, topics:
Energy & Mining, Climate Change, Environment
Last updated:
apr 23, 2017
Indicators value changes by year
Minimum:
1.878K
jan 1, 1961
Maximum:
52.713K
jan 1, 1993
At the date of observation
Value
Absolute change
Change from previous value
jan 1, 1961
1.878K
+1.878K
0.0%
jan 1, 1962
2.457K
+579.386
30.86%
jan 1, 1963
2.34K
-117.344
-4.78%
jan 1, 1964
2.457K
+117.344
5.02%
jan 1, 1965
3.234K
+777.404
31.64%
jan 1, 1966
4.257K
+1.023K
31.63%
jan 1, 1967
5.178K
+920.417
21.62%
jan 1, 1968
6.634K
+1.456K
28.12%
jan 1, 1969
3.528K
-3.106K
-46.82%
jan 1, 1970
3.751K
+223.687
6.34%
jan 1, 1971
5.497K
+1.745K
46.53%
jan 1, 1972
6.41K
+913.083
16.61%
jan 1, 1973
7.041K
+630.724
9.84%
jan 1, 1974
8.588K
+1.547K
21.98%
jan 1, 1975
9.666K
+1.078K
12.55%
jan 1, 1976
9.63K
-36.67
-0.38%
jan 1, 1977
11.302K
+1.672K
17.36%
jan 1, 1978
8.837K
-2.464K
-21.8%
jan 1, 1979
9.145K
+308.028
3.49%
jan 1, 1980
13.726K
+4.58K
50.08%
jan 1, 1981
21.096K
+7.371K
53.7%
jan 1, 1982
24.976K
+3.88K
18.39%
jan 1, 1983
29.131K
+4.155K
16.63%
jan 1, 1984
29.472K
+341.031
1.17%
jan 1, 1985
37.763K
+8.291K
28.13%
jan 1, 1986
35.53K
-2.233K
-5.91%
jan 1, 1987
38.155K
+2.626K
7.39%
jan 1, 1988
26.934K
-11.221K
-29.41%
jan 1, 1989
33.223K
+6.289K
23.35%
jan 1, 1990
32.603K
-619.723
-1.87%
jan 1, 1991
28.713K
-3.891K
-11.93%
jan 1, 1992
28.76K
+47.671
0.17%
jan 1, 1993
52.713K
+23.953K
83.28%
jan 1, 1994
46.076K
-6.637K
-12.59%
jan 1, 1995
32.933K
-13.143K
-28.52%
jan 1, 1996
21.525K
-11.408K
-34.64%
jan 1, 1997
27.084K
+5.559K
25.83%
jan 1, 1998
28.214K
+1.129K
4.17%
jan 1, 1999
27.337K
-876.413
-3.11%
jan 1, 2000
31.434K
+4.096K
14.98%
jan 1, 2001
31.364K
-69.673
-0.22%
jan 1, 2002
33.417K
+2.054K
6.55%
jan 1, 2003
37.407K
+3.99K
11.94%
jan 1, 2004
33.249K
-4.158K
-11.12%
jan 1, 2005
30.876K
-2.373K
-7.14%
jan 1, 2006
40.711K
+9.835K
31.85%
jan 1, 2007
32.658K
-8.053K
-19.78%
jan 1, 2008
27.469K
-5.189K
-15.89%
jan 1, 2009
33.685K
+6.216K
22.63%
jan 1, 2010
27.932K
-5.754K
-17.08%
jan 1, 2011
36.773K
+8.841K
31.65%
jan 1, 2012
34.129K
-2.644K
-7.19%
jan 1, 2013
37.059K
+2.93K
8.58%
jan 1, 2014
36.212K
-847.077
-2.29%
Ranking of countries by current statistics by years


Comments: