29
/
en
AIzaSyAYiBZKx7MnpbEhh9jyipgxe19OcubqV5w
April 1, 2024
153362
Iceland
ISL
true
2
1
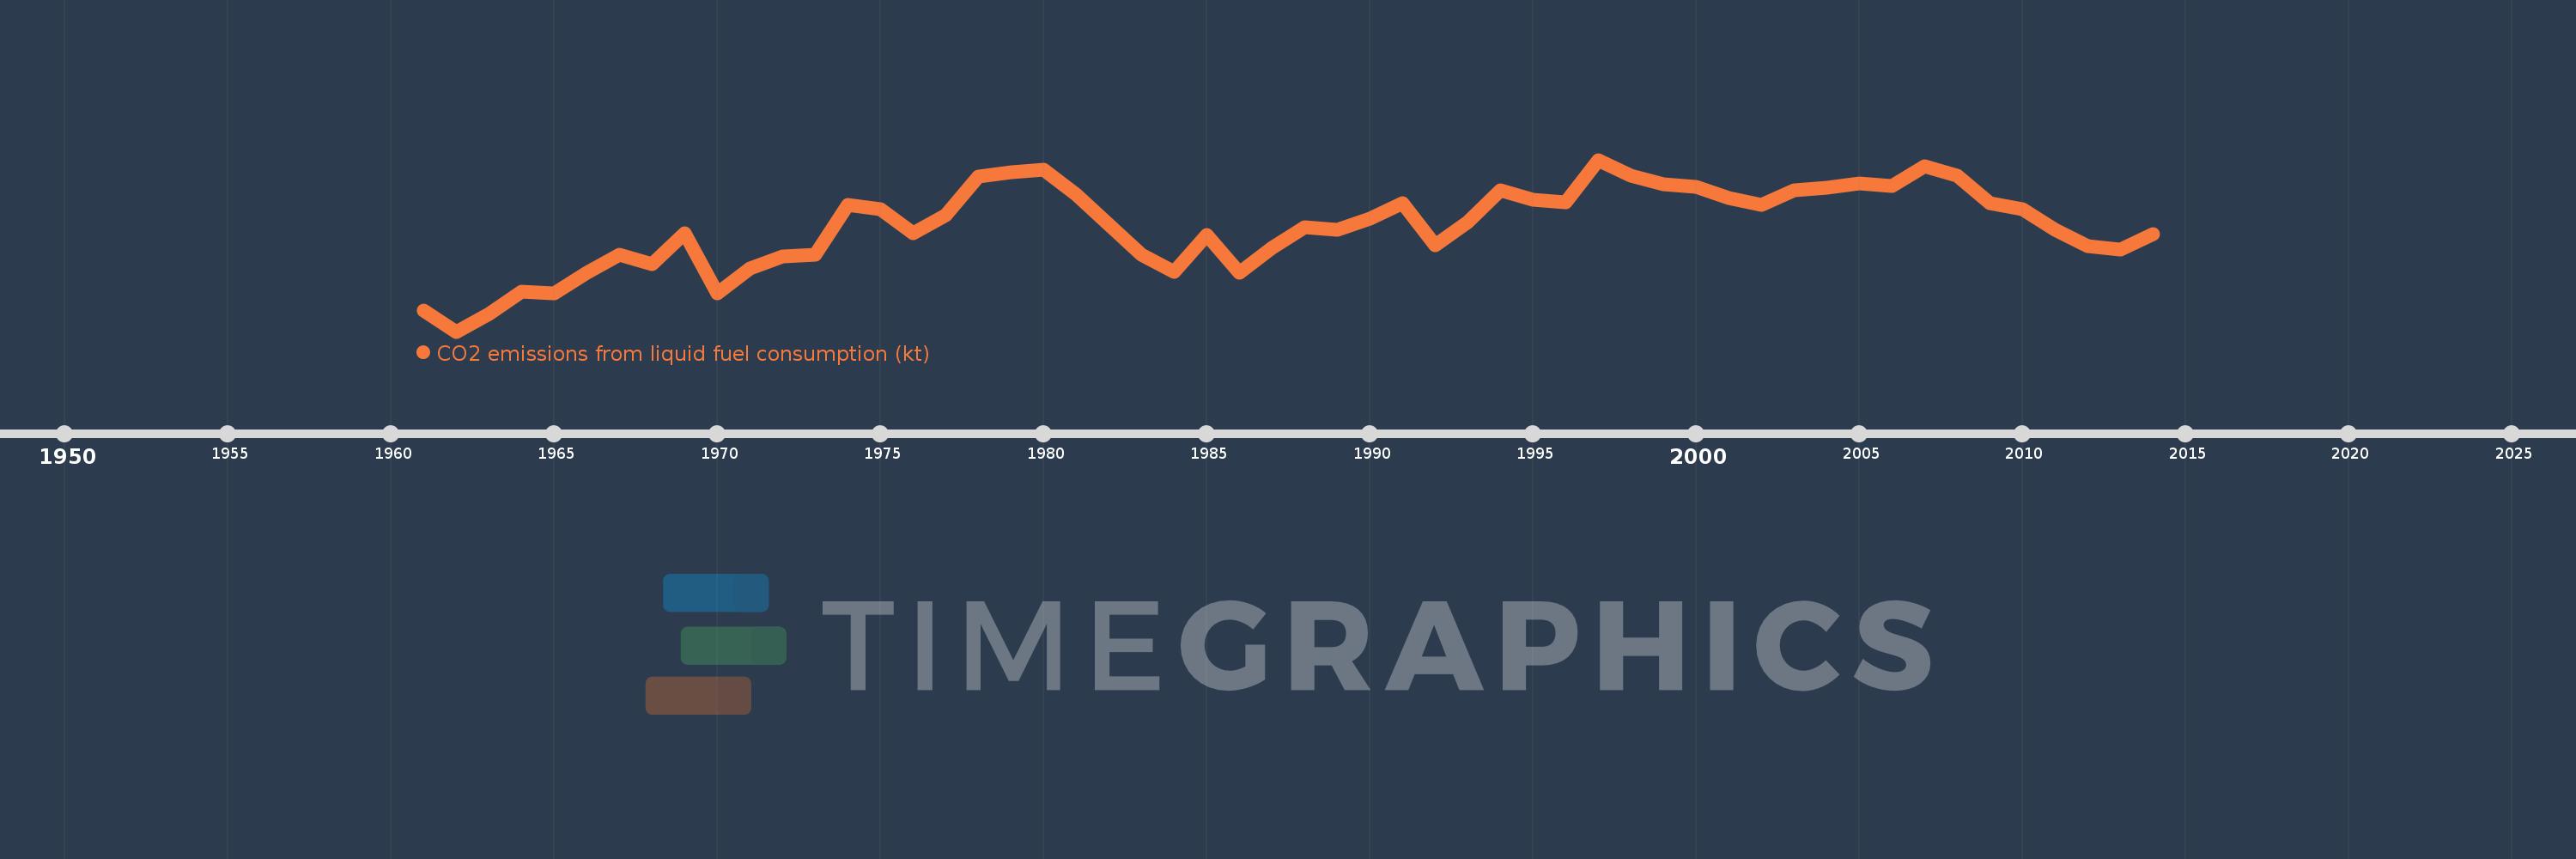
CO2 emissions from liquid fuel consumption (kt)
2014,2013,2012,2011,2010,2009,2008,2007,2006,2005,2004,2003,2002,2001,2000,1999,1998,1997,1996,1995,1994,1993,1992,1991,1990,1989,1988,1987,1986,1985,1984,1983,1982,1981,1980,1979,1978,1977,1976,1975,1974,1973,1972,1971,1970,1969,1968,1967,1966,1965,1964,1963,1962,1961
This statistics in other country:
AfghanistanAlbaniaAlgeriaAndorraAngolaAntigua and BarbudaArab WorldArgentinaArmeniaArubaAustraliaAustriaAzerbaijanBahamas, TheBahrainBangladeshBarbadosBelarusBelgiumBelizeBeninBermudaBhutanBoliviaBosnia and HerzegovinaBotswanaBrazilBritish Virgin IslandsBrunei DarussalamBulgariaBurkina FasoBurundiCabo VerdeCambodiaCameroonCanadaCaribbean small statesCayman IslandsCentral African RepublicCentral Europe and the BalticsChadChileChinaColombiaComorosCongo, Dem. Rep.Congo, Rep.Costa RicaCote d'IvoireCroatiaCubaCuracaoCyprusCzech RepublicDenmarkDjiboutiDominicaDominican RepublicEarly-demographic dividendEast Asia & PacificEast Asia & Pacific (excluding high income)East Asia & Pacific (IDA & IBRD countries)EcuadorEgypt, Arab Rep.El SalvadorEquatorial GuineaEritreaEstoniaEthiopiaEuro areaEurope & Central AsiaEurope & Central Asia (excluding high income)Europe & Central Asia (IDA & IBRD countries)European UnionFaroe IslandsFijiFinlandFragile and conflict affected situationsFranceFrench PolynesiaGabonGambia, TheGeorgiaGermanyGhanaGibraltarGreeceGreenlandGrenadaGuatemalaGuineaGuinea-BissauGuyanaHaitiHeavily indebted poor countries (HIPC)High incomeHondurasHong Kong SAR, ChinaHungaryIBRD onlyIcelandIDA & IBRD totalIDA blendIDA onlyIDA totalIndiaIndonesiaIran, Islamic Rep.IraqIrelandIsraelItalyJamaicaJapanJordanKazakhstanKenyaKiribatiKorea, Dem. People’s Rep.Korea, Rep.KuwaitKyrgyz RepublicLao PDRLate-demographic dividendLatin America & Caribbean Latin America & Caribbean (excluding high income)Latin America & the Caribbean (IDA & IBRD countries)LatviaLeast developed countries: UN classificationLebanonLesothoLiberiaLibyaLiechtensteinLithuaniaLow & middle incomeLow incomeLower middle incomeLuxembourgMacao SAR, ChinaMacedonia, FYRMadagascarMalawiMalaysiaMaldivesMaliMaltaMarshall IslandsMauritaniaMauritiusMexicoMicronesia, Fed. Sts.Middle East & North AfricaMiddle East & North Africa (excluding high income)Middle East & North Africa (IDA & IBRD countries)Middle incomeMoldovaMongoliaMontenegroMoroccoMozambiqueMyanmarNamibiaNauruNepalNetherlandsNew CaledoniaNew ZealandNicaraguaNigerNigeriaNorth AmericaNorwayOECD membersOmanOther small statesPacific island small statesPakistanPalauPanamaPapua New GuineaParaguayPeruPhilippinesPolandPortugalPost-demographic dividendPre-demographic dividendQatarRomaniaRussian FederationRwandaSamoaSao Tome and PrincipeSaudi ArabiaSenegalSerbiaSeychellesSierra LeoneSingaporeSint Maarten (Dutch part)Slovak RepublicSloveniaSmall statesSolomon IslandsSomaliaSouth AfricaSouth AsiaSouth Asia (IDA & IBRD)South SudanSpainSri LankaSt. Kitts and NevisSt. LuciaSt. Vincent and the GrenadinesSub-Saharan Africa Sub-Saharan Africa (excluding high income)Sub-Saharan Africa (IDA & IBRD countries)SudanSurinameSwazilandSwedenSwitzerlandSyrian Arab RepublicTajikistanTanzaniaThailandTimor-LesteTogoTongaTrinidad and TobagoTunisiaTurkeyTurkmenistanTurks and Caicos IslandsUgandaUkraineUnited Arab EmiratesUnited KingdomUnited StatesUpper middle incomeUruguayUzbekistanVanuatuVenezuela, RBVietnamWest Bank and GazaWorldYemen, Rep.ZambiaZimbabwe Timeline:
This timeline shows a graph from 1961 to 2014 of Iceland. No data until 1960. Number of actual observations by date: 54.
Source name:
World Development Indicators
Source organization:
Carbon Dioxide Information Analysis Center, Environmental Sciences Division, Oak Ridge National Laboratory, Tennessee, United States.
Categories, topics:
Energy & Mining, Climate Change, Environment
Last updated:
apr 23, 2017
Indicators value changes by year
Minimum:
1.012K
jan 1, 1962
Maximum:
1.925K
jan 1, 1997
At the date of observation
Value
Absolute change
Change from previous value
jan 1, 1961
1.122K
+1.122K
0.0%
jan 1, 1962
1.012K
-110.01
-9.8%
jan 1, 1963
1.107K
+95.342
9.42%
jan 1, 1964
1.225K
+117.344
10.6%
jan 1, 1965
1.217K
-7.334
-0.6%
jan 1, 1966
1.324K
+106.343
8.73%
jan 1, 1967
1.423K
+99.009
7.48%
jan 1, 1968
1.371K
-51.338
-3.61%
jan 1, 1969
1.536K
+165.015
12.03%
jan 1, 1970
1.214K
-322.696
-21.0%
jan 1, 1971
1.346K
+132.012
10.88%
jan 1, 1972
1.412K
+66.006
4.9%
jan 1, 1973
1.419K
+7.334
0.52%
jan 1, 1974
1.687K
+267.691
18.86%
jan 1, 1975
1.665K
-22.002
-1.3%
jan 1, 1976
1.536K
-128.345
-7.71%
jan 1, 1977
1.632K
+95.342
6.21%
jan 1, 1978
1.837K
+205.352
12.58%
jan 1, 1979
1.859K
+22.002
1.2%
jan 1, 1980
1.874K
+14.668
0.79%
jan 1, 1981
1.738K
-135.679
-7.24%
jan 1, 1982
1.58K
-157.681
-9.07%
jan 1, 1983
1.423K
-157.681
-9.98%
jan 1, 1984
1.327K
-95.342
-6.7%
jan 1, 1985
1.525K
+198.018
14.92%
jan 1, 1986
1.324K
-201.685
-13.22%
jan 1, 1987
1.459K
+135.679
10.25%
jan 1, 1988
1.566K
+106.343
7.29%
jan 1, 1989
1.555K
-11.001
-0.7%
jan 1, 1990
1.613K
+58.672
3.77%
jan 1, 1991
1.694K
+80.674
5.0%
jan 1, 1992
1.47K
-223.687
-13.2%
jan 1, 1993
1.595K
+124.678
8.48%
jan 1, 1994
1.764K
+168.682
10.57%
jan 1, 1995
1.712K
-51.338
-2.91%
jan 1, 1996
1.698K
-14.668
-0.86%
jan 1, 1997
1.925K
+227.354
13.39%
jan 1, 1998
1.841K
-84.341
-4.38%
jan 1, 1999
1.793K
-47.671
-2.59%
jan 1, 2000
1.782K
-11.001
-0.61%
jan 1, 2001
1.72K
-62.339
-3.5%
jan 1, 2002
1.687K
-33.003
-1.92%
jan 1, 2003
1.764K
+77.007
4.57%
jan 1, 2004
1.778K
+14.668
0.83%
jan 1, 2005
1.8K
+22.002
1.24%
jan 1, 2006
1.786K
-14.668
-0.81%
jan 1, 2007
1.892K
+106.343
5.95%
jan 1, 2008
1.841K
-51.338
-2.71%
jan 1, 2009
1.694K
-146.68
-7.97%
jan 1, 2010
1.661K
-33.003
-1.95%
jan 1, 2011
1.551K
-110.01
-6.62%
jan 1, 2012
1.467K
-84.341
-5.44%
jan 1, 2013
1.448K
-18.335
-1.25%
jan 1, 2014
1.529K
+80.674
5.57%
Ranking of countries by current statistics by years


Comments: