29
/
en
AIzaSyAYiBZKx7MnpbEhh9jyipgxe19OcubqV5w
April 1, 2024
191213
Malta
MLT
true
2
1
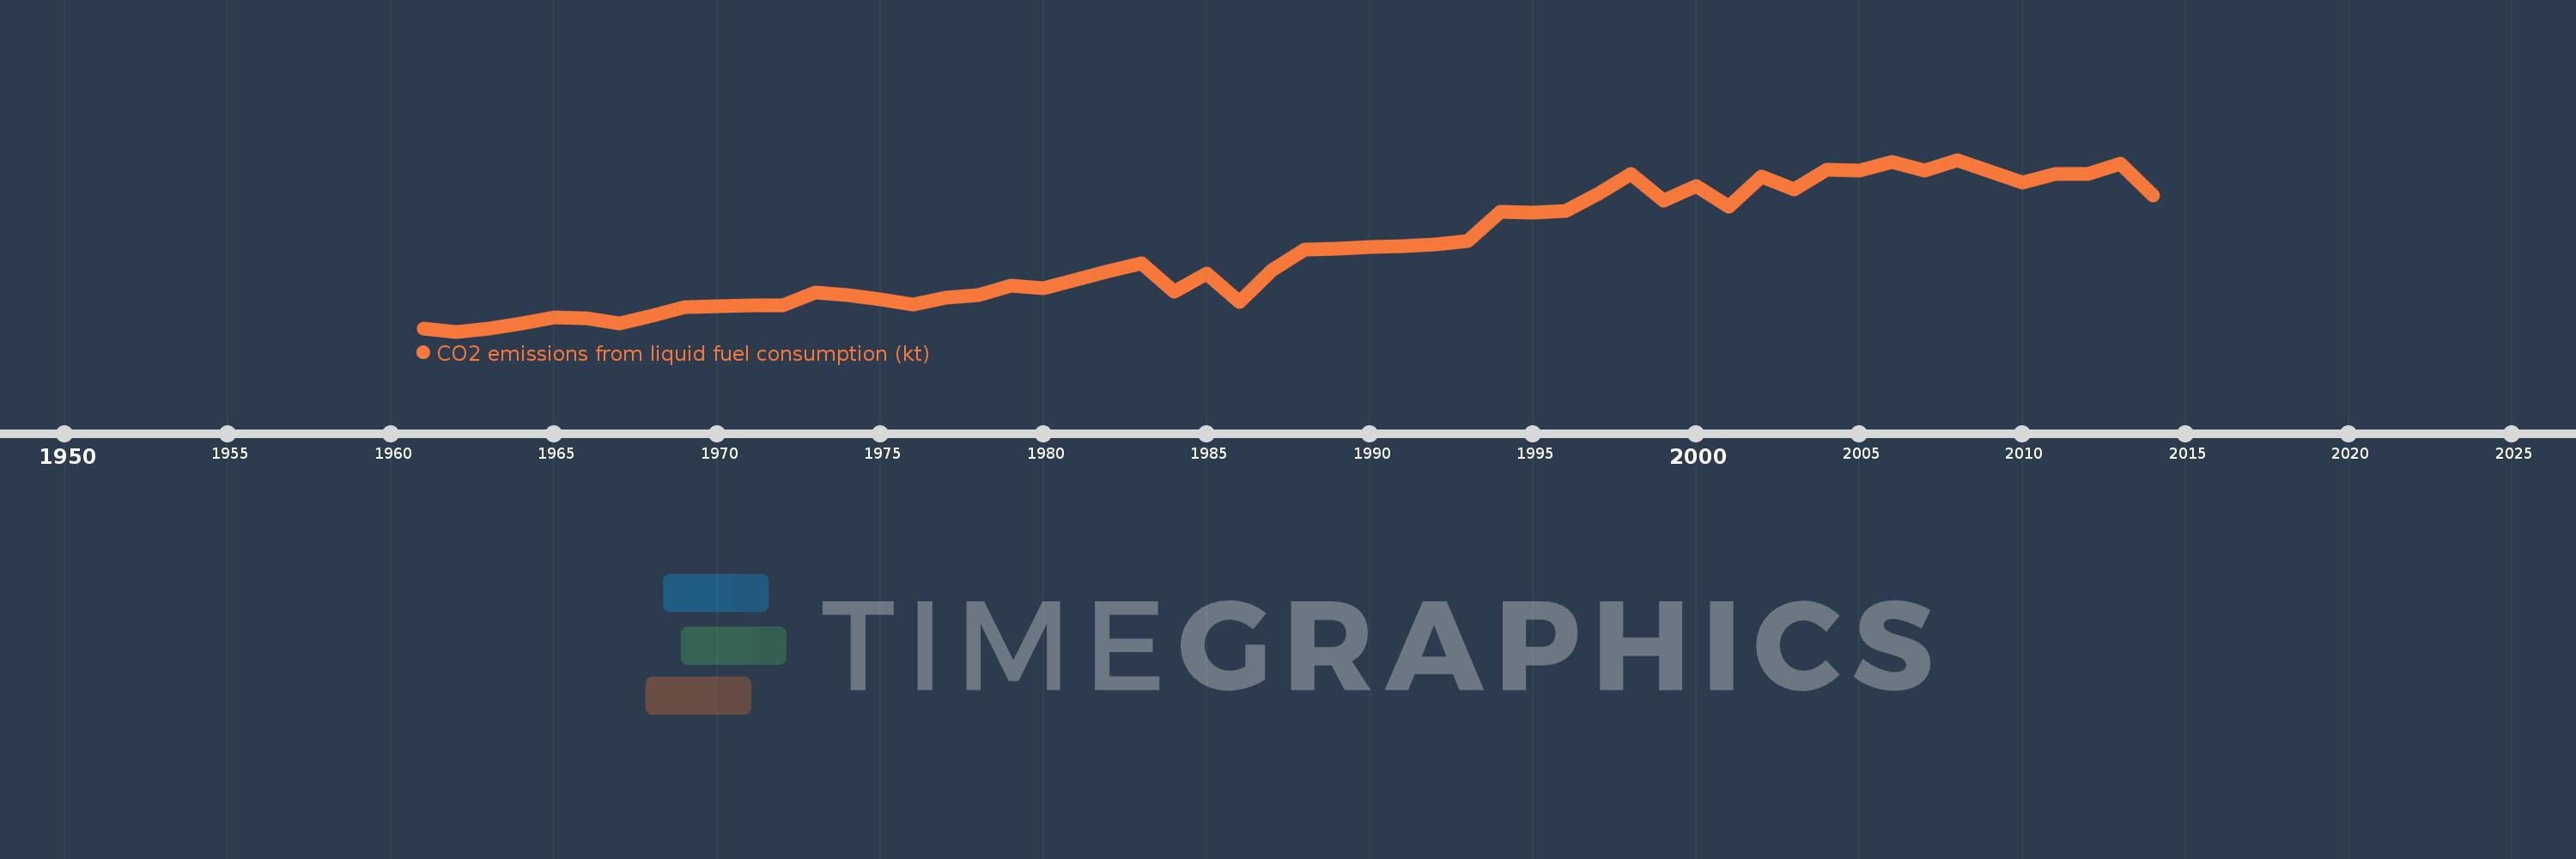
CO2 emissions from liquid fuel consumption (kt)
2014,2013,2012,2011,2010,2009,2008,2007,2006,2005,2004,2003,2002,2001,2000,1999,1998,1997,1996,1995,1994,1993,1992,1991,1990,1989,1988,1987,1986,1985,1984,1983,1982,1981,1980,1979,1978,1977,1976,1975,1974,1973,1972,1971,1970,1969,1968,1967,1966,1965,1964,1963,1962,1961
This statistics in other country:
AfghanistanAlbaniaAlgeriaAndorraAngolaAntigua and BarbudaArab WorldArgentinaArmeniaArubaAustraliaAustriaAzerbaijanBahamas, TheBahrainBangladeshBarbadosBelarusBelgiumBelizeBeninBermudaBhutanBoliviaBosnia and HerzegovinaBotswanaBrazilBritish Virgin IslandsBrunei DarussalamBulgariaBurkina FasoBurundiCabo VerdeCambodiaCameroonCanadaCaribbean small statesCayman IslandsCentral African RepublicCentral Europe and the BalticsChadChileChinaColombiaComorosCongo, Dem. Rep.Congo, Rep.Costa RicaCote d'IvoireCroatiaCubaCuracaoCyprusCzech RepublicDenmarkDjiboutiDominicaDominican RepublicEarly-demographic dividendEast Asia & PacificEast Asia & Pacific (excluding high income)East Asia & Pacific (IDA & IBRD countries)EcuadorEgypt, Arab Rep.El SalvadorEquatorial GuineaEritreaEstoniaEthiopiaEuro areaEurope & Central AsiaEurope & Central Asia (excluding high income)Europe & Central Asia (IDA & IBRD countries)European UnionFaroe IslandsFijiFinlandFragile and conflict affected situationsFranceFrench PolynesiaGabonGambia, TheGeorgiaGermanyGhanaGibraltarGreeceGreenlandGrenadaGuatemalaGuineaGuinea-BissauGuyanaHaitiHeavily indebted poor countries (HIPC)High incomeHondurasHong Kong SAR, ChinaHungaryIBRD onlyIcelandIDA & IBRD totalIDA blendIDA onlyIDA totalIndiaIndonesiaIran, Islamic Rep.IraqIrelandIsraelItalyJamaicaJapanJordanKazakhstanKenyaKiribatiKorea, Dem. People’s Rep.Korea, Rep.KuwaitKyrgyz RepublicLao PDRLate-demographic dividendLatin America & Caribbean Latin America & Caribbean (excluding high income)Latin America & the Caribbean (IDA & IBRD countries)LatviaLeast developed countries: UN classificationLebanonLesothoLiberiaLibyaLiechtensteinLithuaniaLow & middle incomeLow incomeLower middle incomeLuxembourgMacao SAR, ChinaMacedonia, FYRMadagascarMalawiMalaysiaMaldivesMaliMaltaMarshall IslandsMauritaniaMauritiusMexicoMicronesia, Fed. Sts.Middle East & North AfricaMiddle East & North Africa (excluding high income)Middle East & North Africa (IDA & IBRD countries)Middle incomeMoldovaMongoliaMontenegroMoroccoMozambiqueMyanmarNamibiaNauruNepalNetherlandsNew CaledoniaNew ZealandNicaraguaNigerNigeriaNorth AmericaNorwayOECD membersOmanOther small statesPacific island small statesPakistanPalauPanamaPapua New GuineaParaguayPeruPhilippinesPolandPortugalPost-demographic dividendPre-demographic dividendQatarRomaniaRussian FederationRwandaSamoaSao Tome and PrincipeSaudi ArabiaSenegalSerbiaSeychellesSierra LeoneSingaporeSint Maarten (Dutch part)Slovak RepublicSloveniaSmall statesSolomon IslandsSomaliaSouth AfricaSouth AsiaSouth Asia (IDA & IBRD)South SudanSpainSri LankaSt. Kitts and NevisSt. LuciaSt. Vincent and the GrenadinesSub-Saharan Africa Sub-Saharan Africa (excluding high income)Sub-Saharan Africa (IDA & IBRD countries)SudanSurinameSwazilandSwedenSwitzerlandSyrian Arab RepublicTajikistanTanzaniaThailandTimor-LesteTogoTongaTrinidad and TobagoTunisiaTurkeyTurkmenistanTurks and Caicos IslandsUgandaUkraineUnited Arab EmiratesUnited KingdomUnited StatesUpper middle incomeUruguayUzbekistanVanuatuVenezuela, RBVietnamWest Bank and GazaWorldYemen, Rep.ZambiaZimbabwe Timeline:
This timeline shows a graph from 1961 to 2014 of Malta. No data until 1960. Number of actual observations by date: 54.
Source name:
World Development Indicators
Source organization:
Carbon Dioxide Information Analysis Center, Environmental Sciences Division, Oak Ridge National Laboratory, Tennessee, United States.
Categories, topics:
Energy & Mining, Climate Change, Environment
Last updated:
apr 23, 2017
Indicators value changes by year
Minimum:
286.026
jan 1, 1962
Maximum:
2.725K
jan 1, 2008
At the date of observation
Value
Absolute change
Change from previous value
jan 1, 1961
330.03
+330.03
0.0%
jan 1, 1962
286.026
-44.004
-13.33%
jan 1, 1963
322.696
+36.67
12.82%
jan 1, 1964
403.37
+80.674
25.0%
jan 1, 1965
487.711
+84.341
20.91%
jan 1, 1966
469.376
-18.335
-3.76%
jan 1, 1967
407.037
-62.339
-13.28%
jan 1, 1968
517.047
+110.01
27.03%
jan 1, 1969
630.724
+113.677
21.99%
jan 1, 1970
649.059
+18.335
2.91%
jan 1, 1971
660.06
+11.001
1.69%
jan 1, 1972
660.06
0.0
0.0%
jan 1, 1973
839.743
+179.683
27.22%
jan 1, 1974
803.073
-36.67
-4.37%
jan 1, 1975
744.401
-58.672
-7.31%
jan 1, 1976
667.394
-77.007
-10.34%
jan 1, 1977
762.736
+95.342
14.29%
jan 1, 1978
803.073
+40.337
5.29%
jan 1, 1979
935.085
+132.012
16.44%
jan 1, 1980
905.749
-29.336
-3.14%
jan 1, 1981
1.019K
+113.677
12.55%
jan 1, 1982
1.14K
+121.011
11.87%
jan 1, 1983
1.25K
+110.01
9.65%
jan 1, 1984
858.078
-392.369
-31.38%
jan 1, 1985
1.115K
+256.69
29.91%
jan 1, 1986
704.064
-410.704
-36.84%
jan 1, 1987
1.155K
+451.041
64.06%
jan 1, 1988
1.445K
+289.693
25.08%
jan 1, 1989
1.459K
+14.668
1.02%
jan 1, 1990
1.485K
+25.669
1.76%
jan 1, 1991
1.5K
+14.668
0.99%
jan 1, 1992
1.525K
+25.669
1.71%
jan 1, 1993
1.577K
+51.338
3.37%
jan 1, 1994
1.991K
+414.371
26.28%
jan 1, 1995
1.98K
-11.001
-0.55%
jan 1, 1996
2.002K
+22.002
1.11%
jan 1, 1997
2.248K
+245.689
12.27%
jan 1, 1998
2.523K
+275.025
12.23%
jan 1, 1999
2.145K
-377.701
-14.97%
jan 1, 2000
2.347K
+201.685
9.4%
jan 1, 2001
2.065K
-282.359
-12.03%
jan 1, 2002
2.486K
+421.705
20.43%
jan 1, 2003
2.299K
-187.017
-7.52%
jan 1, 2004
2.582K
+282.359
12.28%
jan 1, 2005
2.574K
-7.334
-0.28%
jan 1, 2006
2.699K
+124.678
4.84%
jan 1, 2007
2.574K
-124.678
-4.62%
jan 1, 2008
2.725K
+150.347
5.84%
jan 1, 2009
2.56K
-165.015
-6.06%
jan 1, 2010
2.398K
-161.348
-6.3%
jan 1, 2011
2.527K
+128.345
5.35%
jan 1, 2012
2.519K
-7.334
-0.29%
jan 1, 2013
2.666K
+146.68
5.82%
jan 1, 2014
2.219K
-447.374
-16.78%
Ranking of countries by current statistics by years


Comments: