29
/
en
AIzaSyAYiBZKx7MnpbEhh9jyipgxe19OcubqV5w
April 1, 2024
245333
South Africa
ZAF
true
2
1
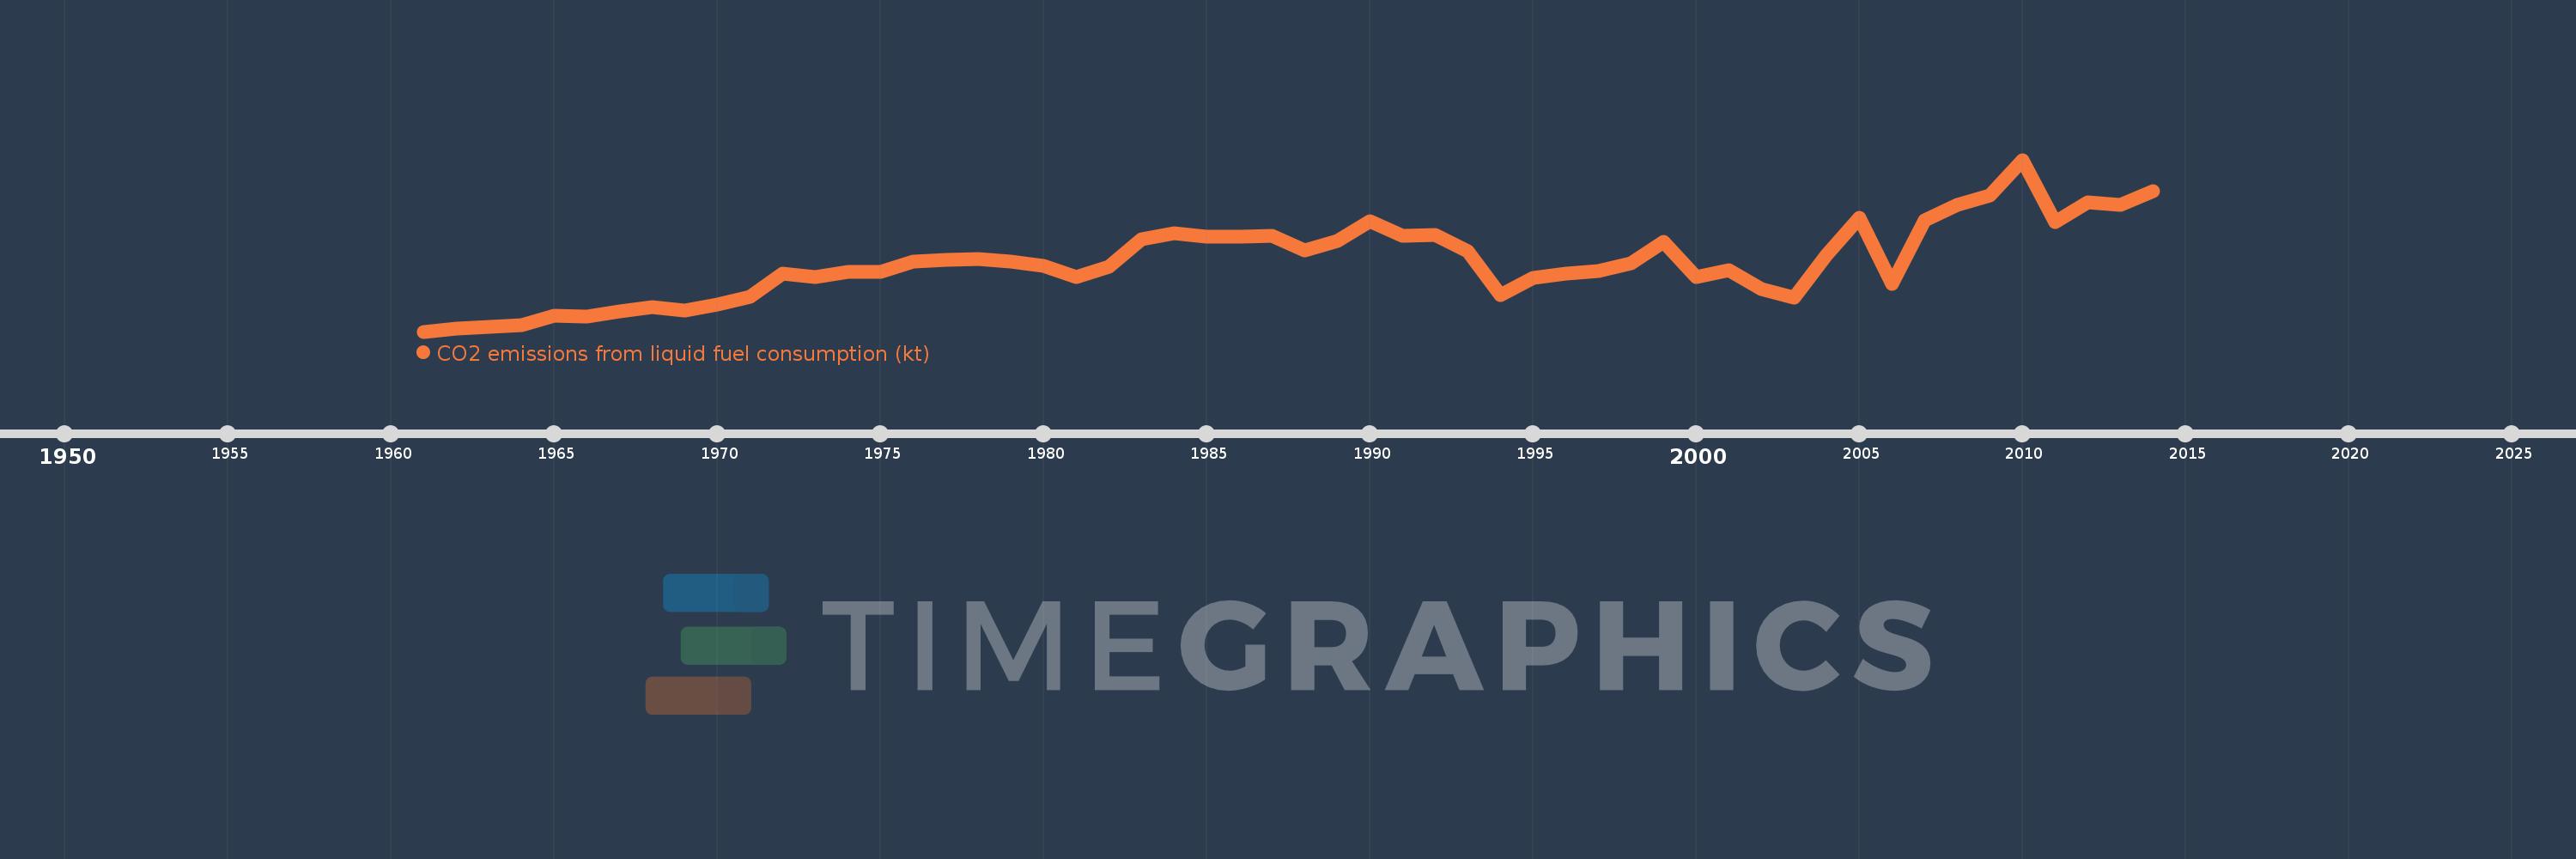
CO2 emissions from liquid fuel consumption (kt)
2014,2013,2012,2011,2010,2009,2008,2007,2006,2005,2004,2003,2002,2001,2000,1999,1998,1997,1996,1995,1994,1993,1992,1991,1990,1989,1988,1987,1986,1985,1984,1983,1982,1981,1980,1979,1978,1977,1976,1975,1974,1973,1972,1971,1970,1969,1968,1967,1966,1965,1964,1963,1962,1961
This statistics in other country:
AfghanistanAlbaniaAlgeriaAndorraAngolaAntigua and BarbudaArab WorldArgentinaArmeniaArubaAustraliaAustriaAzerbaijanBahamas, TheBahrainBangladeshBarbadosBelarusBelgiumBelizeBeninBermudaBhutanBoliviaBosnia and HerzegovinaBotswanaBrazilBritish Virgin IslandsBrunei DarussalamBulgariaBurkina FasoBurundiCabo VerdeCambodiaCameroonCanadaCaribbean small statesCayman IslandsCentral African RepublicCentral Europe and the BalticsChadChileChinaColombiaComorosCongo, Dem. Rep.Congo, Rep.Costa RicaCote d'IvoireCroatiaCubaCuracaoCyprusCzech RepublicDenmarkDjiboutiDominicaDominican RepublicEarly-demographic dividendEast Asia & PacificEast Asia & Pacific (excluding high income)East Asia & Pacific (IDA & IBRD countries)EcuadorEgypt, Arab Rep.El SalvadorEquatorial GuineaEritreaEstoniaEthiopiaEuro areaEurope & Central AsiaEurope & Central Asia (excluding high income)Europe & Central Asia (IDA & IBRD countries)European UnionFaroe IslandsFijiFinlandFragile and conflict affected situationsFranceFrench PolynesiaGabonGambia, TheGeorgiaGermanyGhanaGibraltarGreeceGreenlandGrenadaGuatemalaGuineaGuinea-BissauGuyanaHaitiHeavily indebted poor countries (HIPC)High incomeHondurasHong Kong SAR, ChinaHungaryIBRD onlyIcelandIDA & IBRD totalIDA blendIDA onlyIDA totalIndiaIndonesiaIran, Islamic Rep.IraqIrelandIsraelItalyJamaicaJapanJordanKazakhstanKenyaKiribatiKorea, Dem. People’s Rep.Korea, Rep.KuwaitKyrgyz RepublicLao PDRLate-demographic dividendLatin America & Caribbean Latin America & Caribbean (excluding high income)Latin America & the Caribbean (IDA & IBRD countries)LatviaLeast developed countries: UN classificationLebanonLesothoLiberiaLibyaLiechtensteinLithuaniaLow & middle incomeLow incomeLower middle incomeLuxembourgMacao SAR, ChinaMacedonia, FYRMadagascarMalawiMalaysiaMaldivesMaliMaltaMarshall IslandsMauritaniaMauritiusMexicoMicronesia, Fed. Sts.Middle East & North AfricaMiddle East & North Africa (excluding high income)Middle East & North Africa (IDA & IBRD countries)Middle incomeMoldovaMongoliaMontenegroMoroccoMozambiqueMyanmarNamibiaNauruNepalNetherlandsNew CaledoniaNew ZealandNicaraguaNigerNigeriaNorth AmericaNorwayOECD membersOmanOther small statesPacific island small statesPakistanPalauPanamaPapua New GuineaParaguayPeruPhilippinesPolandPortugalPost-demographic dividendPre-demographic dividendQatarRomaniaRussian FederationRwandaSamoaSao Tome and PrincipeSaudi ArabiaSenegalSerbiaSeychellesSierra LeoneSingaporeSint Maarten (Dutch part)Slovak RepublicSloveniaSmall statesSolomon IslandsSomaliaSouth AfricaSouth AsiaSouth Asia (IDA & IBRD)South SudanSpainSri LankaSt. Kitts and NevisSt. LuciaSt. Vincent and the GrenadinesSub-Saharan Africa Sub-Saharan Africa (excluding high income)Sub-Saharan Africa (IDA & IBRD countries)SudanSurinameSwazilandSwedenSwitzerlandSyrian Arab RepublicTajikistanTanzaniaThailandTimor-LesteTogoTongaTrinidad and TobagoTunisiaTurkeyTurkmenistanTurks and Caicos IslandsUgandaUkraineUnited Arab EmiratesUnited KingdomUnited StatesUpper middle incomeUruguayUzbekistanVanuatuVenezuela, RBVietnamWest Bank and GazaWorldYemen, Rep.ZambiaZimbabwe Timeline:
This timeline shows a graph from 1961 to 2014 of South Africa. No data until 1960. Number of actual observations by date: 54.
Source name:
World Development Indicators
Source organization:
Carbon Dioxide Information Analysis Center, Environmental Sciences Division, Oak Ridge National Laboratory, Tennessee, United States.
Categories, topics:
Energy & Mining, Climate Change, Environment
Last updated:
apr 23, 2017
Indicators value changes by year
Minimum:
9.076K
jan 1, 1961
Maximum:
77.33K
jan 1, 2010
At the date of observation
Value
Absolute change
Change from previous value
jan 1, 1961
9.076K
+9.076K
0.0%
jan 1, 1962
10.374K
+1.298K
14.3%
jan 1, 1963
11.1K
+726.066
7.0%
jan 1, 1964
11.705K
+605.055
5.45%
jan 1, 1965
15.299K
+3.594K
30.7%
jan 1, 1966
15.134K
-165.015
-1.08%
jan 1, 1967
17.231K
+2.098K
13.86%
jan 1, 1968
18.889K
+1.657K
9.62%
jan 1, 1969
17.312K
-1.577K
-8.35%
jan 1, 1970
19.926K
+2.615K
15.1%
jan 1, 1971
22.9K
+2.974K
14.92%
jan 1, 1972
32.116K
+9.215K
40.24%
jan 1, 1973
30.704K
-1.412K
-4.4%
jan 1, 1974
32.757K
+2.054K
6.69%
jan 1, 1975
32.633K
-124.678
-0.38%
jan 1, 1976
37.033K
+4.4K
13.48%
jan 1, 1977
37.715K
+682.062
1.84%
jan 1, 1978
37.946K
+231.021
0.61%
jan 1, 1979
37.026K
-920.417
-2.43%
jan 1, 1980
35.343K
-1.683K
-4.55%
jan 1, 1981
30.645K
-4.697K
-13.29%
jan 1, 1982
35.005K
+4.36K
14.23%
jan 1, 1983
45.812K
+10.807K
30.87%
jan 1, 1984
48.272K
+2.461K
5.37%
jan 1, 1985
46.875K
-1.397K
-2.89%
jan 1, 1986
46.952K
+77.007
0.16%
jan 1, 1987
46.982K
+29.336
0.06%
jan 1, 1988
41.455K
-5.526K
-11.76%
jan 1, 1989
44.917K
+3.462K
8.35%
jan 1, 1990
52.918K
+8.001K
17.81%
jan 1, 1991
47.139K
-5.779K
-10.92%
jan 1, 1992
47.48K
+341.031
0.72%
jan 1, 1993
40.916K
-6.564K
-13.82%
jan 1, 1994
23.546K
-17.371K
-42.45%
jan 1, 1995
30.264K
+6.718K
28.53%
jan 1, 1996
32.116K
+1.852K
6.12%
jan 1, 1997
33.032K
+916.75
2.85%
jan 1, 1998
36.245K
+3.212K
9.72%
jan 1, 1999
44.624K
+8.379K
23.12%
jan 1, 2000
30.715K
-13.909K
-31.17%
jan 1, 2001
33.329K
+2.615K
8.51%
jan 1, 2002
25.907K
-7.422K
-22.27%
jan 1, 2003
22.468K
-3.44K
-13.28%
jan 1, 2004
39.776K
+17.308K
77.04%
jan 1, 2005
54.283K
+14.507K
36.47%
jan 1, 2006
27.855K
-26.428K
-48.69%
jan 1, 2007
53.124K
+25.269K
90.72%
jan 1, 2008
59.376K
+6.252K
11.77%
jan 1, 2009
63.285K
+3.909K
6.58%
jan 1, 2010
77.33K
+14.045K
22.19%
jan 1, 2011
52.643K
-24.686K
-31.92%
jan 1, 2012
60.487K
+7.844K
14.9%
jan 1, 2013
59.277K
-1.21K
-2.0%
jan 1, 2014
64.752K
+5.475K
9.24%
Ranking of countries by current statistics by years


Comments: