29
/
en
AIzaSyAYiBZKx7MnpbEhh9jyipgxe19OcubqV5w
April 1, 2024
214115
Norway
NOR
true
2
1
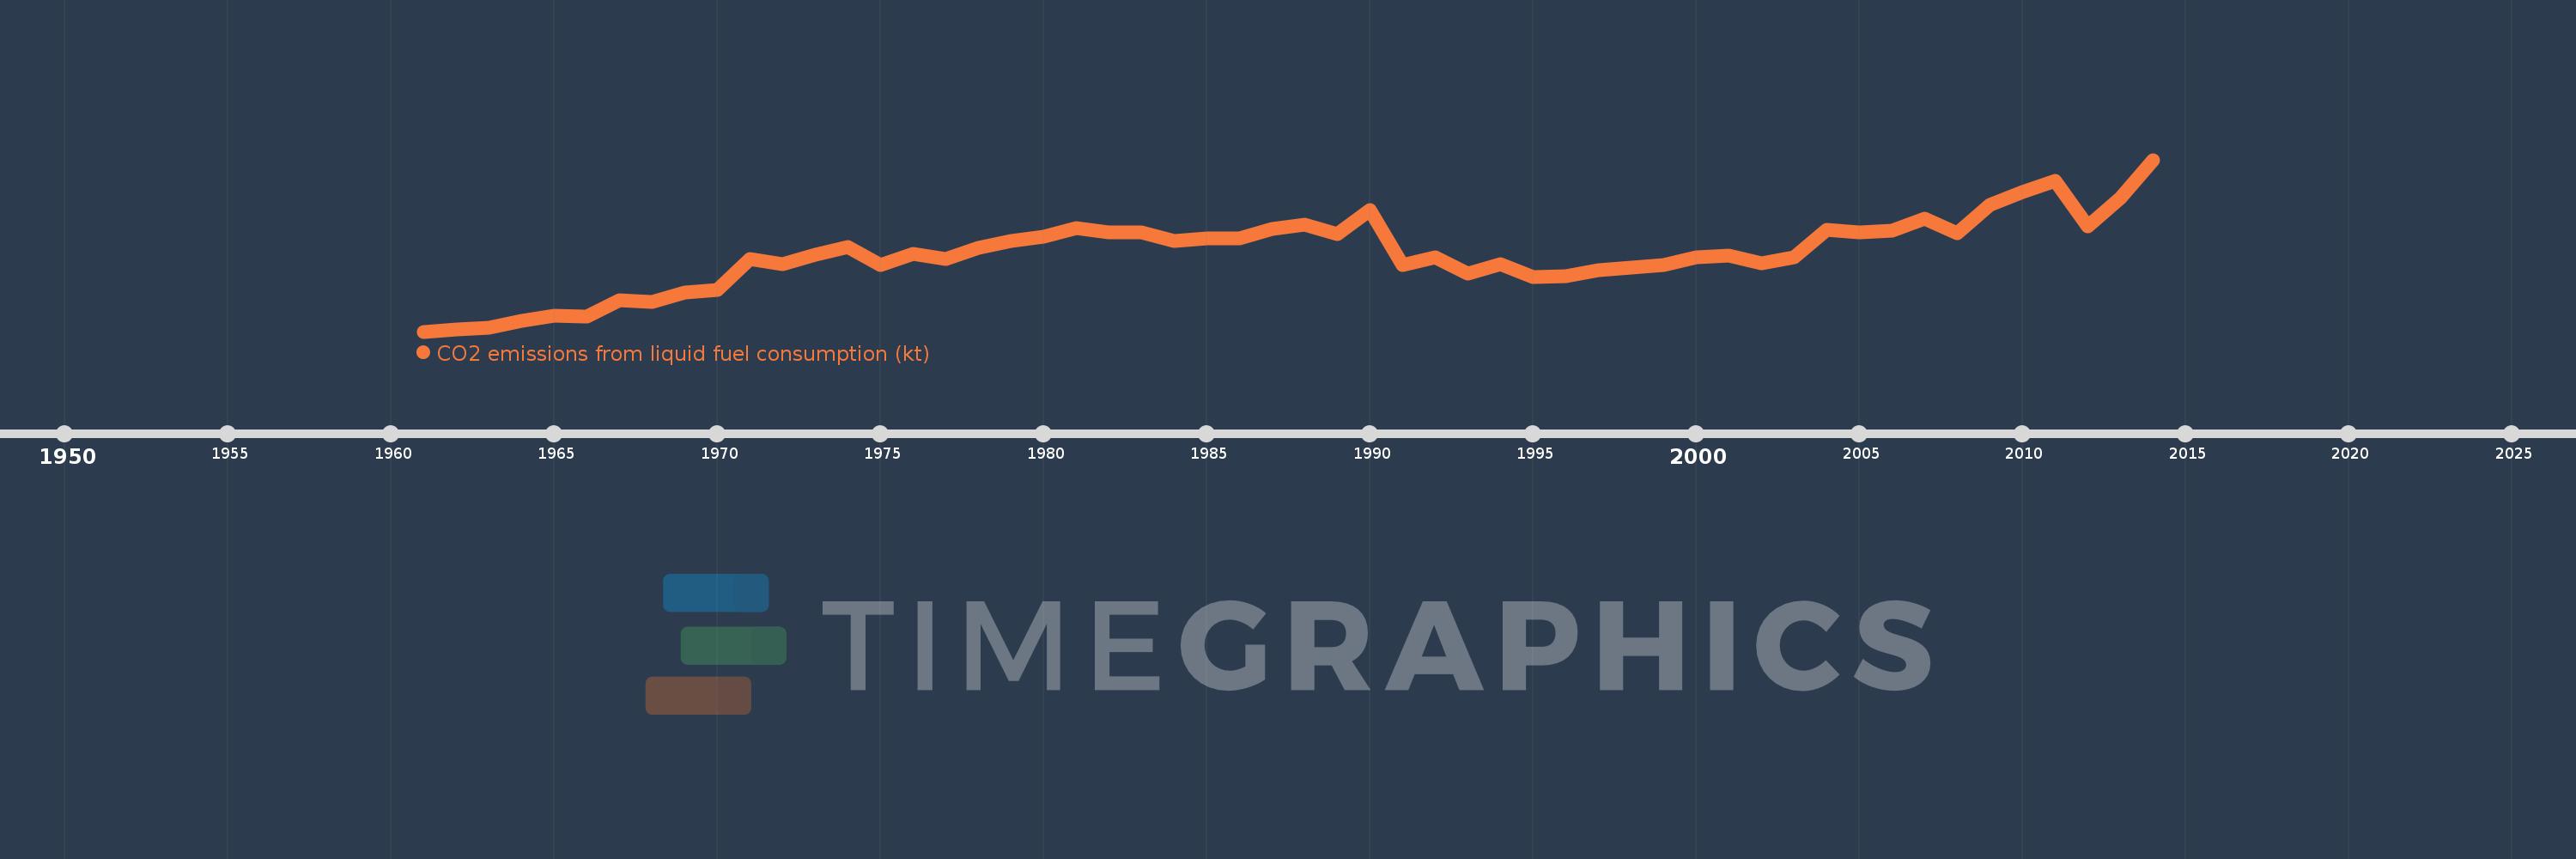
CO2 emissions from liquid fuel consumption (kt)
2014,2013,2012,2011,2010,2009,2008,2007,2006,2005,2004,2003,2002,2001,2000,1999,1998,1997,1996,1995,1994,1993,1992,1991,1990,1989,1988,1987,1986,1985,1984,1983,1982,1981,1980,1979,1978,1977,1976,1975,1974,1973,1972,1971,1970,1969,1968,1967,1966,1965,1964,1963,1962,1961
This statistics in other country:
AfghanistanAlbaniaAlgeriaAndorraAngolaAntigua and BarbudaArab WorldArgentinaArmeniaArubaAustraliaAustriaAzerbaijanBahamas, TheBahrainBangladeshBarbadosBelarusBelgiumBelizeBeninBermudaBhutanBoliviaBosnia and HerzegovinaBotswanaBrazilBritish Virgin IslandsBrunei DarussalamBulgariaBurkina FasoBurundiCabo VerdeCambodiaCameroonCanadaCaribbean small statesCayman IslandsCentral African RepublicCentral Europe and the BalticsChadChileChinaColombiaComorosCongo, Dem. Rep.Congo, Rep.Costa RicaCote d'IvoireCroatiaCubaCuracaoCyprusCzech RepublicDenmarkDjiboutiDominicaDominican RepublicEarly-demographic dividendEast Asia & PacificEast Asia & Pacific (excluding high income)East Asia & Pacific (IDA & IBRD countries)EcuadorEgypt, Arab Rep.El SalvadorEquatorial GuineaEritreaEstoniaEthiopiaEuro areaEurope & Central AsiaEurope & Central Asia (excluding high income)Europe & Central Asia (IDA & IBRD countries)European UnionFaroe IslandsFijiFinlandFragile and conflict affected situationsFranceFrench PolynesiaGabonGambia, TheGeorgiaGermanyGhanaGibraltarGreeceGreenlandGrenadaGuatemalaGuineaGuinea-BissauGuyanaHaitiHeavily indebted poor countries (HIPC)High incomeHondurasHong Kong SAR, ChinaHungaryIBRD onlyIcelandIDA & IBRD totalIDA blendIDA onlyIDA totalIndiaIndonesiaIran, Islamic Rep.IraqIrelandIsraelItalyJamaicaJapanJordanKazakhstanKenyaKiribatiKorea, Dem. People’s Rep.Korea, Rep.KuwaitKyrgyz RepublicLao PDRLate-demographic dividendLatin America & Caribbean Latin America & Caribbean (excluding high income)Latin America & the Caribbean (IDA & IBRD countries)LatviaLeast developed countries: UN classificationLebanonLesothoLiberiaLibyaLiechtensteinLithuaniaLow & middle incomeLow incomeLower middle incomeLuxembourgMacao SAR, ChinaMacedonia, FYRMadagascarMalawiMalaysiaMaldivesMaliMaltaMarshall IslandsMauritaniaMauritiusMexicoMicronesia, Fed. Sts.Middle East & North AfricaMiddle East & North Africa (excluding high income)Middle East & North Africa (IDA & IBRD countries)Middle incomeMoldovaMongoliaMontenegroMoroccoMozambiqueMyanmarNamibiaNauruNepalNetherlandsNew CaledoniaNew ZealandNicaraguaNigerNigeriaNorth AmericaNorwayOECD membersOmanOther small statesPacific island small statesPakistanPalauPanamaPapua New GuineaParaguayPeruPhilippinesPolandPortugalPost-demographic dividendPre-demographic dividendQatarRomaniaRussian FederationRwandaSamoaSao Tome and PrincipeSaudi ArabiaSenegalSerbiaSeychellesSierra LeoneSingaporeSint Maarten (Dutch part)Slovak RepublicSloveniaSmall statesSolomon IslandsSomaliaSouth AfricaSouth AsiaSouth Asia (IDA & IBRD)South SudanSpainSri LankaSt. Kitts and NevisSt. LuciaSt. Vincent and the GrenadinesSub-Saharan Africa Sub-Saharan Africa (excluding high income)Sub-Saharan Africa (IDA & IBRD countries)SudanSurinameSwazilandSwedenSwitzerlandSyrian Arab RepublicTajikistanTanzaniaThailandTimor-LesteTogoTongaTrinidad and TobagoTunisiaTurkeyTurkmenistanTurks and Caicos IslandsUgandaUkraineUnited Arab EmiratesUnited KingdomUnited StatesUpper middle incomeUruguayUzbekistanVanuatuVenezuela, RBVietnamWest Bank and GazaWorldYemen, Rep.ZambiaZimbabwe Timeline:
This timeline shows a graph from 1961 to 2014 of Norway. No data until 1960. Number of actual observations by date: 54.
Source name:
World Development Indicators
Source organization:
Carbon Dioxide Information Analysis Center, Environmental Sciences Division, Oak Ridge National Laboratory, Tennessee, United States.
Categories, topics:
Energy & Mining, Climate Change, Environment
Last updated:
apr 23, 2017
Indicators value changes by year
Minimum:
9.516K
jan 1, 1961
Maximum:
41.672K
jan 1, 2014
At the date of observation
Value
Absolute change
Change from previous value
jan 1, 1961
9.516K
+9.516K
0.0%
jan 1, 1962
9.894K
+377.701
3.97%
jan 1, 1963
10.268K
+374.034
3.78%
jan 1, 1964
11.573K
+1.305K
12.71%
jan 1, 1965
12.497K
+924.084
7.98%
jan 1, 1966
12.273K
-223.687
-1.79%
jan 1, 1967
15.372K
+3.099K
25.25%
jan 1, 1968
15.06K
-311.695
-2.03%
jan 1, 1969
16.821K
+1.76K
11.69%
jan 1, 1970
17.374K
+553.717
3.29%
jan 1, 1971
23.117K
+5.743K
33.05%
jan 1, 1972
22.156K
-960.754
-4.16%
jan 1, 1973
23.92K
+1.764K
7.96%
jan 1, 1974
25.42K
+1.5K
6.27%
jan 1, 1975
21.995K
-3.425K
-13.47%
jan 1, 1976
24.045K
+2.05K
9.32%
jan 1, 1977
23.025K
-1.019K
-4.24%
jan 1, 1978
25.167K
+2.142K
9.3%
jan 1, 1979
26.49K
+1.324K
5.26%
jan 1, 1980
27.275K
+784.738
2.96%
jan 1, 1981
28.907K
+1.632K
5.98%
jan 1, 1982
28.009K
-898.415
-3.11%
jan 1, 1983
28.148K
+139.346
0.5%
jan 1, 1984
26.479K
-1.668K
-5.93%
jan 1, 1985
27.018K
+539.049
2.04%
jan 1, 1986
27.026K
+7.334
0.03%
jan 1, 1987
28.76K
+1.734K
6.42%
jan 1, 1988
29.552K
+792.072
2.75%
jan 1, 1989
27.715K
-1.837K
-6.22%
jan 1, 1990
32.317K
+4.602K
16.6%
jan 1, 1991
21.929K
-10.389K
-32.15%
jan 1, 1992
23.348K
+1.419K
6.47%
jan 1, 1993
20.396K
-2.952K
-12.64%
jan 1, 1994
22.061K
+1.665K
8.16%
jan 1, 1995
19.67K
-2.391K
-10.84%
jan 1, 1996
19.948K
+278.692
1.42%
jan 1, 1997
20.979K
+1.03K
5.17%
jan 1, 1998
21.525K
+546.383
2.6%
jan 1, 1999
22.05K
+524.381
2.44%
jan 1, 2000
23.439K
+1.39K
6.3%
jan 1, 2001
23.817K
+377.701
1.61%
jan 1, 2002
22.226K
-1.591K
-6.68%
jan 1, 2003
23.381K
+1.155K
5.2%
jan 1, 2004
28.584K
+5.203K
22.26%
jan 1, 2005
28.1K
-484.044
-1.69%
jan 1, 2006
28.386K
+286.026
1.02%
jan 1, 2007
30.594K
+2.208K
7.78%
jan 1, 2008
27.939K
-2.655K
-8.68%
jan 1, 2009
33.219K
+5.28K
18.9%
jan 1, 2010
35.676K
+2.457K
7.4%
jan 1, 2011
37.77K
+2.094K
5.87%
jan 1, 2012
29.23K
-8.54K
-22.61%
jan 1, 2013
34.481K
+5.251K
17.97%
jan 1, 2014
41.672K
+7.191K
20.86%
Ranking of countries by current statistics by years


Comments: