29
/
en
AIzaSyAYiBZKx7MnpbEhh9jyipgxe19OcubqV5w
April 1, 2024
211467
Niger
NER
true
2
1
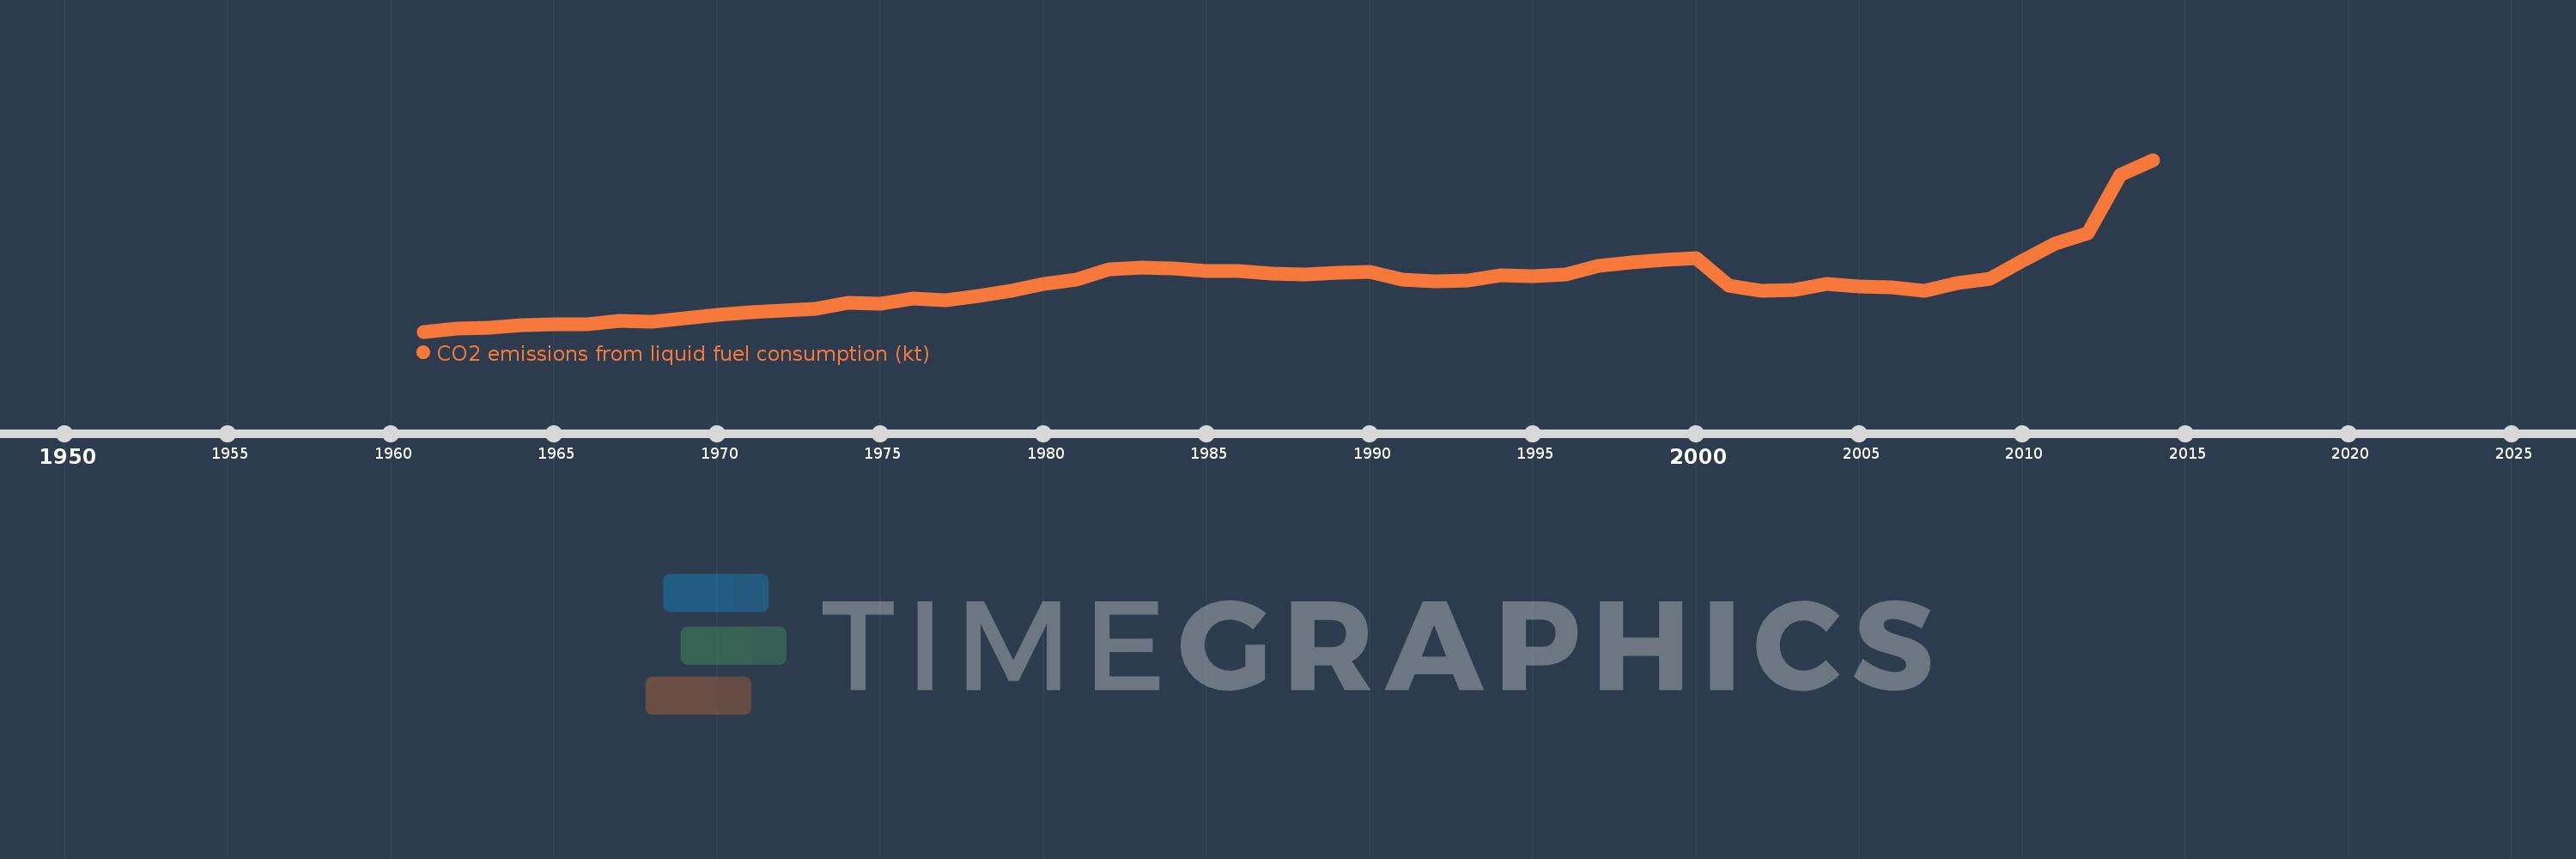
CO2 emissions from liquid fuel consumption (kt)
2014,2013,2012,2011,2010,2009,2008,2007,2006,2005,2004,2003,2002,2001,2000,1999,1998,1997,1996,1995,1994,1993,1992,1991,1990,1989,1988,1987,1986,1985,1984,1983,1982,1981,1980,1979,1978,1977,1976,1975,1974,1973,1972,1971,1970,1969,1968,1967,1966,1965,1964,1963,1962,1961
This statistics in other country:
AfghanistanAlbaniaAlgeriaAndorraAngolaAntigua and BarbudaArab WorldArgentinaArmeniaArubaAustraliaAustriaAzerbaijanBahamas, TheBahrainBangladeshBarbadosBelarusBelgiumBelizeBeninBermudaBhutanBoliviaBosnia and HerzegovinaBotswanaBrazilBritish Virgin IslandsBrunei DarussalamBulgariaBurkina FasoBurundiCabo VerdeCambodiaCameroonCanadaCaribbean small statesCayman IslandsCentral African RepublicCentral Europe and the BalticsChadChileChinaColombiaComorosCongo, Dem. Rep.Congo, Rep.Costa RicaCote d'IvoireCroatiaCubaCuracaoCyprusCzech RepublicDenmarkDjiboutiDominicaDominican RepublicEarly-demographic dividendEast Asia & PacificEast Asia & Pacific (excluding high income)East Asia & Pacific (IDA & IBRD countries)EcuadorEgypt, Arab Rep.El SalvadorEquatorial GuineaEritreaEstoniaEthiopiaEuro areaEurope & Central AsiaEurope & Central Asia (excluding high income)Europe & Central Asia (IDA & IBRD countries)European UnionFaroe IslandsFijiFinlandFragile and conflict affected situationsFranceFrench PolynesiaGabonGambia, TheGeorgiaGermanyGhanaGibraltarGreeceGreenlandGrenadaGuatemalaGuineaGuinea-BissauGuyanaHaitiHeavily indebted poor countries (HIPC)High incomeHondurasHong Kong SAR, ChinaHungaryIBRD onlyIcelandIDA & IBRD totalIDA blendIDA onlyIDA totalIndiaIndonesiaIran, Islamic Rep.IraqIrelandIsraelItalyJamaicaJapanJordanKazakhstanKenyaKiribatiKorea, Dem. People’s Rep.Korea, Rep.KuwaitKyrgyz RepublicLao PDRLate-demographic dividendLatin America & Caribbean Latin America & Caribbean (excluding high income)Latin America & the Caribbean (IDA & IBRD countries)LatviaLeast developed countries: UN classificationLebanonLesothoLiberiaLibyaLiechtensteinLithuaniaLow & middle incomeLow incomeLower middle incomeLuxembourgMacao SAR, ChinaMacedonia, FYRMadagascarMalawiMalaysiaMaldivesMaliMaltaMarshall IslandsMauritaniaMauritiusMexicoMicronesia, Fed. Sts.Middle East & North AfricaMiddle East & North Africa (excluding high income)Middle East & North Africa (IDA & IBRD countries)Middle incomeMoldovaMongoliaMontenegroMoroccoMozambiqueMyanmarNamibiaNauruNepalNetherlandsNew CaledoniaNew ZealandNicaraguaNigerNigeriaNorth AmericaNorwayOECD membersOmanOther small statesPacific island small statesPakistanPalauPanamaPapua New GuineaParaguayPeruPhilippinesPolandPortugalPost-demographic dividendPre-demographic dividendQatarRomaniaRussian FederationRwandaSamoaSao Tome and PrincipeSaudi ArabiaSenegalSerbiaSeychellesSierra LeoneSingaporeSint Maarten (Dutch part)Slovak RepublicSloveniaSmall statesSolomon IslandsSomaliaSouth AfricaSouth AsiaSouth Asia (IDA & IBRD)South SudanSpainSri LankaSt. Kitts and NevisSt. LuciaSt. Vincent and the GrenadinesSub-Saharan Africa Sub-Saharan Africa (excluding high income)Sub-Saharan Africa (IDA & IBRD countries)SudanSurinameSwazilandSwedenSwitzerlandSyrian Arab RepublicTajikistanTanzaniaThailandTimor-LesteTogoTongaTrinidad and TobagoTunisiaTurkeyTurkmenistanTurks and Caicos IslandsUgandaUkraineUnited Arab EmiratesUnited KingdomUnited StatesUpper middle incomeUruguayUzbekistanVanuatuVenezuela, RBVietnamWest Bank and GazaWorldYemen, Rep.ZambiaZimbabwe Timeline:
This timeline shows a graph from 1961 to 2014 of Niger. No data until 1960. Number of actual observations by date: 54.
Source name:
World Development Indicators
Source organization:
Carbon Dioxide Information Analysis Center, Environmental Sciences Division, Oak Ridge National Laboratory, Tennessee, United States.
Categories, topics:
Energy & Mining, Climate Change, Environment
Last updated:
apr 23, 2017
Indicators value changes by year
Minimum:
29.336
jan 1, 1961
Maximum:
1.584K
jan 1, 2014
At the date of observation
Value
Absolute change
Change from previous value
jan 1, 1961
29.336
+29.336
0.0%
jan 1, 1962
55.005
+25.669
87.5%
jan 1, 1963
66.006
+11.001
20.0%
jan 1, 1964
88.008
+22.002
33.33%
jan 1, 1965
95.342
+7.334
8.33%
jan 1, 1966
91.675
-3.667
-3.85%
jan 1, 1967
128.345
+36.67
40.0%
jan 1, 1968
121.011
-7.334
-5.71%
jan 1, 1969
150.347
+29.336
24.24%
jan 1, 1970
179.683
+29.336
19.51%
jan 1, 1971
201.685
+22.002
12.24%
jan 1, 1972
216.353
+14.668
7.27%
jan 1, 1973
238.355
+22.002
10.17%
jan 1, 1974
293.36
+55.005
23.08%
jan 1, 1975
278.692
-14.668
-5.0%
jan 1, 1976
326.363
+47.671
17.11%
jan 1, 1977
315.362
-11.001
-3.37%
jan 1, 1978
348.365
+33.003
10.47%
jan 1, 1979
396.036
+47.671
13.68%
jan 1, 1980
462.042
+66.006
16.67%
jan 1, 1981
498.712
+36.67
7.94%
jan 1, 1982
590.387
+91.675
18.38%
jan 1, 1983
612.389
+22.002
3.73%
jan 1, 1984
601.388
-11.001
-1.8%
jan 1, 1985
575.719
-25.669
-4.27%
jan 1, 1986
575.719
0.0
0.0%
jan 1, 1987
557.384
-18.335
-3.18%
jan 1, 1988
546.383
-11.001
-1.97%
jan 1, 1989
564.718
+18.335
3.36%
jan 1, 1990
572.052
+7.334
1.3%
jan 1, 1991
498.712
-73.34
-12.82%
jan 1, 1992
480.377
-18.335
-3.68%
jan 1, 1993
491.378
+11.001
2.29%
jan 1, 1994
539.049
+47.671
9.7%
jan 1, 1995
531.715
-7.334
-1.36%
jan 1, 1996
550.05
+18.335
3.45%
jan 1, 1997
623.39
+73.34
13.33%
jan 1, 1998
656.393
+33.003
5.29%
jan 1, 1999
682.062
+25.669
3.91%
jan 1, 2000
693.063
+11.001
1.61%
jan 1, 2001
447.374
-245.689
-35.45%
jan 1, 2002
399.703
-47.671
-10.66%
jan 1, 2003
407.037
+7.334
1.83%
jan 1, 2004
462.042
+55.005
13.51%
jan 1, 2005
436.373
-25.669
-5.56%
jan 1, 2006
429.039
-7.334
-1.68%
jan 1, 2007
399.703
-29.336
-6.84%
jan 1, 2008
465.709
+66.006
16.51%
jan 1, 2009
509.713
+44.004
9.45%
jan 1, 2010
667.394
+157.681
30.94%
jan 1, 2011
828.742
+161.348
24.18%
jan 1, 2012
916.75
+88.008
10.62%
jan 1, 2013
1.445K
+528.048
57.6%
jan 1, 2014
1.584K
+139.346
9.64%
Ranking of countries by current statistics by years


Comments: