29
/
en
AIzaSyAYiBZKx7MnpbEhh9jyipgxe19OcubqV5w
April 1, 2024
92430
Brunei Darussalam
BRN
true
2
1
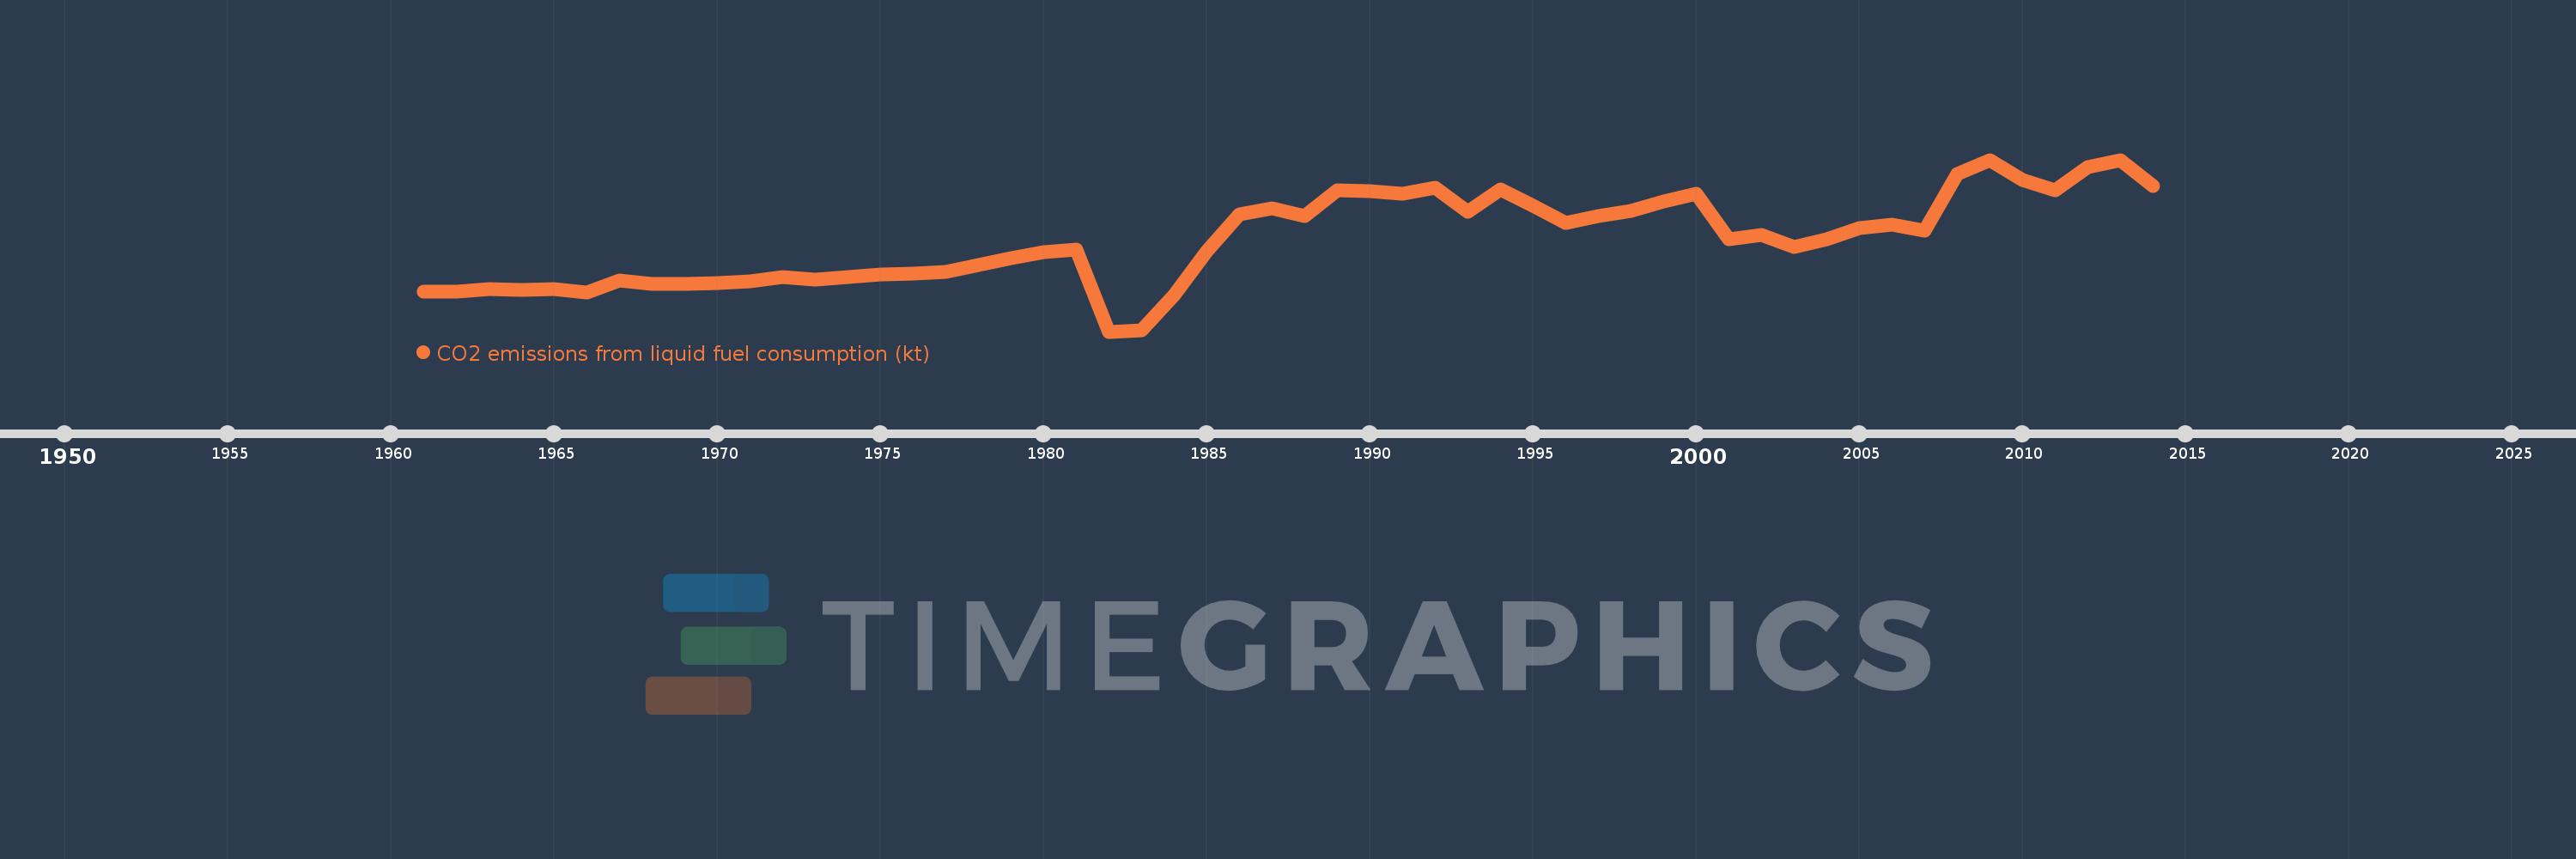
CO2 emissions from liquid fuel consumption (kt)
2014,2013,2012,2011,2010,2009,2008,2007,2006,2005,2004,2003,2002,2001,2000,1999,1998,1997,1996,1995,1994,1993,1992,1991,1990,1989,1988,1987,1986,1985,1984,1983,1982,1981,1980,1979,1978,1977,1976,1975,1974,1973,1972,1971,1970,1969,1968,1967,1966,1965,1964,1963,1962,1961
This statistics in other country:
AfghanistanAlbaniaAlgeriaAndorraAngolaAntigua and BarbudaArab WorldArgentinaArmeniaArubaAustraliaAustriaAzerbaijanBahamas, TheBahrainBangladeshBarbadosBelarusBelgiumBelizeBeninBermudaBhutanBoliviaBosnia and HerzegovinaBotswanaBrazilBritish Virgin IslandsBrunei DarussalamBulgariaBurkina FasoBurundiCabo VerdeCambodiaCameroonCanadaCaribbean small statesCayman IslandsCentral African RepublicCentral Europe and the BalticsChadChileChinaColombiaComorosCongo, Dem. Rep.Congo, Rep.Costa RicaCote d'IvoireCroatiaCubaCuracaoCyprusCzech RepublicDenmarkDjiboutiDominicaDominican RepublicEarly-demographic dividendEast Asia & PacificEast Asia & Pacific (excluding high income)East Asia & Pacific (IDA & IBRD countries)EcuadorEgypt, Arab Rep.El SalvadorEquatorial GuineaEritreaEstoniaEthiopiaEuro areaEurope & Central AsiaEurope & Central Asia (excluding high income)Europe & Central Asia (IDA & IBRD countries)European UnionFaroe IslandsFijiFinlandFragile and conflict affected situationsFranceFrench PolynesiaGabonGambia, TheGeorgiaGermanyGhanaGibraltarGreeceGreenlandGrenadaGuatemalaGuineaGuinea-BissauGuyanaHaitiHeavily indebted poor countries (HIPC)High incomeHondurasHong Kong SAR, ChinaHungaryIBRD onlyIcelandIDA & IBRD totalIDA blendIDA onlyIDA totalIndiaIndonesiaIran, Islamic Rep.IraqIrelandIsraelItalyJamaicaJapanJordanKazakhstanKenyaKiribatiKorea, Dem. People’s Rep.Korea, Rep.KuwaitKyrgyz RepublicLao PDRLate-demographic dividendLatin America & Caribbean Latin America & Caribbean (excluding high income)Latin America & the Caribbean (IDA & IBRD countries)LatviaLeast developed countries: UN classificationLebanonLesothoLiberiaLibyaLiechtensteinLithuaniaLow & middle incomeLow incomeLower middle incomeLuxembourgMacao SAR, ChinaMacedonia, FYRMadagascarMalawiMalaysiaMaldivesMaliMaltaMarshall IslandsMauritaniaMauritiusMexicoMicronesia, Fed. Sts.Middle East & North AfricaMiddle East & North Africa (excluding high income)Middle East & North Africa (IDA & IBRD countries)Middle incomeMoldovaMongoliaMontenegroMoroccoMozambiqueMyanmarNamibiaNauruNepalNetherlandsNew CaledoniaNew ZealandNicaraguaNigerNigeriaNorth AmericaNorwayOECD membersOmanOther small statesPacific island small statesPakistanPalauPanamaPapua New GuineaParaguayPeruPhilippinesPolandPortugalPost-demographic dividendPre-demographic dividendQatarRomaniaRussian FederationRwandaSamoaSao Tome and PrincipeSaudi ArabiaSenegalSerbiaSeychellesSierra LeoneSingaporeSint Maarten (Dutch part)Slovak RepublicSloveniaSmall statesSolomon IslandsSomaliaSouth AfricaSouth AsiaSouth Asia (IDA & IBRD)South SudanSpainSri LankaSt. Kitts and NevisSt. LuciaSt. Vincent and the GrenadinesSub-Saharan Africa Sub-Saharan Africa (excluding high income)Sub-Saharan Africa (IDA & IBRD countries)SudanSurinameSwazilandSwedenSwitzerlandSyrian Arab RepublicTajikistanTanzaniaThailandTimor-LesteTogoTongaTrinidad and TobagoTunisiaTurkeyTurkmenistanTurks and Caicos IslandsUgandaUkraineUnited Arab EmiratesUnited KingdomUnited StatesUpper middle incomeUruguayUzbekistanVanuatuVenezuela, RBVietnamWest Bank and GazaWorldYemen, Rep.ZambiaZimbabwe Timeline:
This timeline shows a graph from 1961 to 2014 of Brunei Darussalam. No data until 1960. Number of actual observations by date: 54.
Source name:
World Development Indicators
Source organization:
Carbon Dioxide Information Analysis Center, Environmental Sciences Division, Oak Ridge National Laboratory, Tennessee, United States.
Categories, topics:
Energy & Mining, Climate Change, Environment
Last updated:
apr 23, 2017
Indicators value changes by year
Minimum:
-590.387
jan 1, 1982
Maximum:
2.068K
jan 1, 2013
At the date of observation
Value
Absolute change
Change from previous value
jan 1, 1961
29.336
+29.336
0.0%
jan 1, 1962
29.336
0.0
0.0%
jan 1, 1963
73.34
+44.004
150.0%
jan 1, 1964
55.005
-18.335
-25.0%
jan 1, 1965
73.34
+18.335
33.33%
jan 1, 1966
11.001
-62.339
-85.0%
jan 1, 1967
201.685
+190.684
1.73K%
jan 1, 1968
143.013
-58.672
-29.09%
jan 1, 1969
143.013
0.0
0.0%
jan 1, 1970
165.015
+22.002
15.38%
jan 1, 1971
190.684
+25.669
15.56%
jan 1, 1972
260.357
+69.673
36.54%
jan 1, 1973
220.02
-40.337
-15.49%
jan 1, 1974
249.356
+29.336
13.33%
jan 1, 1975
293.36
+44.004
17.65%
jan 1, 1976
300.694
+7.334
2.5%
jan 1, 1977
337.364
+36.67
12.2%
jan 1, 1978
443.707
+106.343
31.52%
jan 1, 1979
542.716
+99.009
22.31%
jan 1, 1980
638.058
+95.342
17.57%
jan 1, 1981
674.728
+36.67
5.75%
jan 1, 1982
-590.387
-1.265K
-187.5%
jan 1, 1983
-572.052
+18.335
-3.11%
jan 1, 1984
-29.336
+542.716
-94.87%
jan 1, 1985
656.393
+685.729
-2.34K%
jan 1, 1986
1.225K
+568.385
86.59%
jan 1, 1987
1.32K
+95.342
7.78%
jan 1, 1988
1.192K
-128.345
-9.72%
jan 1, 1989
1.602K
+410.704
34.46%
jan 1, 1990
1.577K
-25.669
-1.6%
jan 1, 1991
1.54K
-36.67
-2.33%
jan 1, 1992
1.639K
+99.009
6.43%
jan 1, 1993
1.261K
-377.701
-23.04%
jan 1, 1994
1.606K
+344.698
27.33%
jan 1, 1995
1.353K
-253.023
-15.75%
jan 1, 1996
1.089K
-264.024
-19.51%
jan 1, 1997
1.195K
+106.343
9.76%
jan 1, 1998
1.28K
+84.341
7.06%
jan 1, 1999
1.423K
+143.013
11.17%
jan 1, 2000
1.547K
+124.678
8.76%
jan 1, 2001
839.743
-707.731
-45.73%
jan 1, 2002
902.082
+62.339
7.42%
jan 1, 2003
718.732
-183.35
-20.33%
jan 1, 2004
839.743
+121.011
16.84%
jan 1, 2005
1.008K
+168.682
20.09%
jan 1, 2006
1.06K
+51.338
5.09%
jan 1, 2007
971.755
-88.008
-8.3%
jan 1, 2008
1.848K
+876.413
90.19%
jan 1, 2009
2.057K
+209.019
11.31%
jan 1, 2010
1.756K
-300.694
-14.62%
jan 1, 2011
1.591K
-165.015
-9.39%
jan 1, 2012
1.958K
+366.7
23.04%
jan 1, 2013
2.068K
+110.01
5.62%
jan 1, 2014
1.657K
-410.704
-19.86%
Ranking of countries by current statistics by years


Comments: