29
/
en
AIzaSyAYiBZKx7MnpbEhh9jyipgxe19OcubqV5w
April 1, 2024
109428
Congo, Dem. Rep.
COD
true
2
1
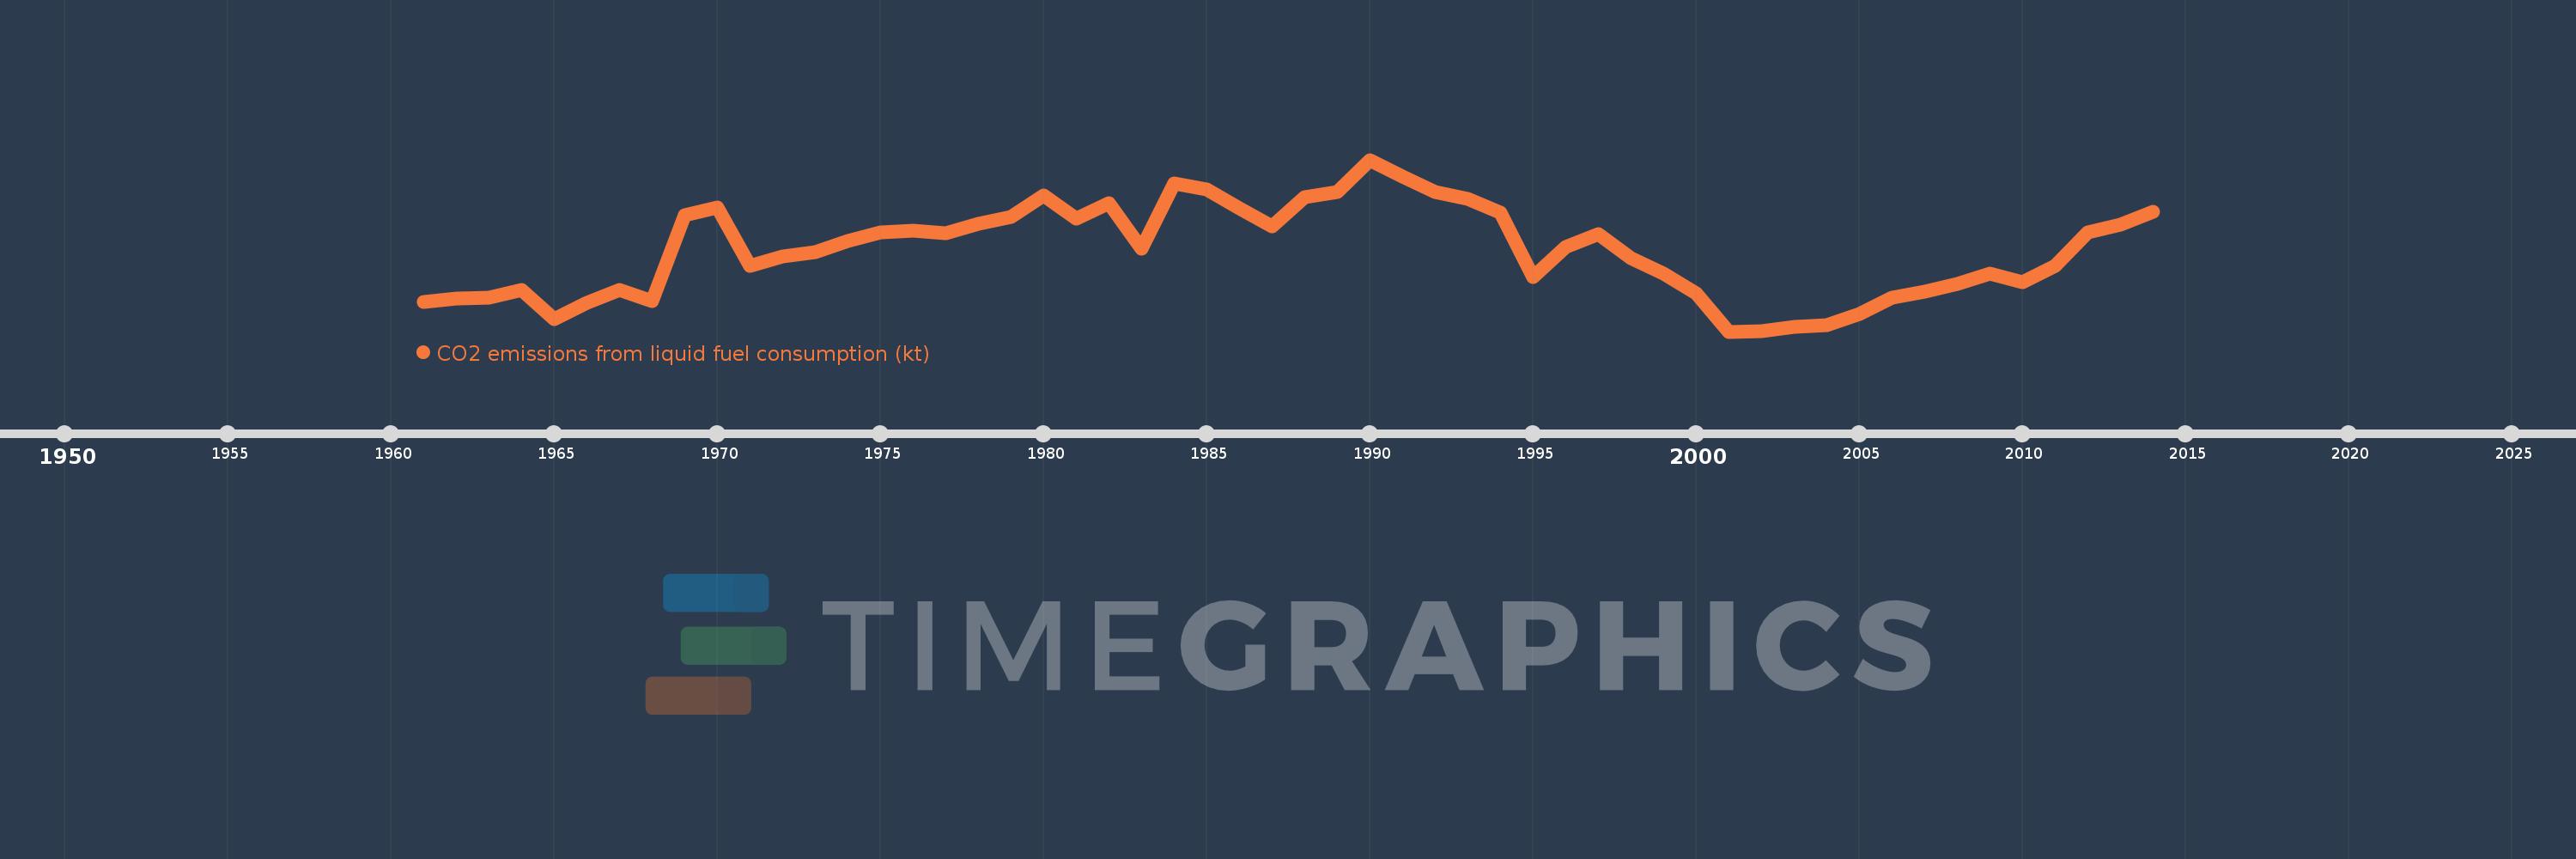
CO2 emissions from liquid fuel consumption (kt)
2014,2013,2012,2011,2010,2009,2008,2007,2006,2005,2004,2003,2002,2001,2000,1999,1998,1997,1996,1995,1994,1993,1992,1991,1990,1989,1988,1987,1986,1985,1984,1983,1982,1981,1980,1979,1978,1977,1976,1975,1974,1973,1972,1971,1970,1969,1968,1967,1966,1965,1964,1963,1962,1961
This statistics in other country:
AfghanistanAlbaniaAlgeriaAndorraAngolaAntigua and BarbudaArab WorldArgentinaArmeniaArubaAustraliaAustriaAzerbaijanBahamas, TheBahrainBangladeshBarbadosBelarusBelgiumBelizeBeninBermudaBhutanBoliviaBosnia and HerzegovinaBotswanaBrazilBritish Virgin IslandsBrunei DarussalamBulgariaBurkina FasoBurundiCabo VerdeCambodiaCameroonCanadaCaribbean small statesCayman IslandsCentral African RepublicCentral Europe and the BalticsChadChileChinaColombiaComorosCongo, Dem. Rep.Congo, Rep.Costa RicaCote d'IvoireCroatiaCubaCuracaoCyprusCzech RepublicDenmarkDjiboutiDominicaDominican RepublicEarly-demographic dividendEast Asia & PacificEast Asia & Pacific (excluding high income)East Asia & Pacific (IDA & IBRD countries)EcuadorEgypt, Arab Rep.El SalvadorEquatorial GuineaEritreaEstoniaEthiopiaEuro areaEurope & Central AsiaEurope & Central Asia (excluding high income)Europe & Central Asia (IDA & IBRD countries)European UnionFaroe IslandsFijiFinlandFragile and conflict affected situationsFranceFrench PolynesiaGabonGambia, TheGeorgiaGermanyGhanaGibraltarGreeceGreenlandGrenadaGuatemalaGuineaGuinea-BissauGuyanaHaitiHeavily indebted poor countries (HIPC)High incomeHondurasHong Kong SAR, ChinaHungaryIBRD onlyIcelandIDA & IBRD totalIDA blendIDA onlyIDA totalIndiaIndonesiaIran, Islamic Rep.IraqIrelandIsraelItalyJamaicaJapanJordanKazakhstanKenyaKiribatiKorea, Dem. People’s Rep.Korea, Rep.KuwaitKyrgyz RepublicLao PDRLate-demographic dividendLatin America & Caribbean Latin America & Caribbean (excluding high income)Latin America & the Caribbean (IDA & IBRD countries)LatviaLeast developed countries: UN classificationLebanonLesothoLiberiaLibyaLiechtensteinLithuaniaLow & middle incomeLow incomeLower middle incomeLuxembourgMacao SAR, ChinaMacedonia, FYRMadagascarMalawiMalaysiaMaldivesMaliMaltaMarshall IslandsMauritaniaMauritiusMexicoMicronesia, Fed. Sts.Middle East & North AfricaMiddle East & North Africa (excluding high income)Middle East & North Africa (IDA & IBRD countries)Middle incomeMoldovaMongoliaMontenegroMoroccoMozambiqueMyanmarNamibiaNauruNepalNetherlandsNew CaledoniaNew ZealandNicaraguaNigerNigeriaNorth AmericaNorwayOECD membersOmanOther small statesPacific island small statesPakistanPalauPanamaPapua New GuineaParaguayPeruPhilippinesPolandPortugalPost-demographic dividendPre-demographic dividendQatarRomaniaRussian FederationRwandaSamoaSao Tome and PrincipeSaudi ArabiaSenegalSerbiaSeychellesSierra LeoneSingaporeSint Maarten (Dutch part)Slovak RepublicSloveniaSmall statesSolomon IslandsSomaliaSouth AfricaSouth AsiaSouth Asia (IDA & IBRD)South SudanSpainSri LankaSt. Kitts and NevisSt. LuciaSt. Vincent and the GrenadinesSub-Saharan Africa Sub-Saharan Africa (excluding high income)Sub-Saharan Africa (IDA & IBRD countries)SudanSurinameSwazilandSwedenSwitzerlandSyrian Arab RepublicTajikistanTanzaniaThailandTimor-LesteTogoTongaTrinidad and TobagoTunisiaTurkeyTurkmenistanTurks and Caicos IslandsUgandaUkraineUnited Arab EmiratesUnited KingdomUnited StatesUpper middle incomeUruguayUzbekistanVanuatuVenezuela, RBVietnamWest Bank and GazaWorldYemen, Rep.ZambiaZimbabwe Timeline:
This timeline shows a graph from 1961 to 2014 of Congo, Dem. Rep.. No data until 1960. Number of actual observations by date: 54.
Source name:
World Development Indicators
Source organization:
Carbon Dioxide Information Analysis Center, Environmental Sciences Division, Oak Ridge National Laboratory, Tennessee, United States.
Categories, topics:
Energy & Mining, Climate Change, Environment
Last updated:
apr 23, 2017
Indicators value changes by year
Minimum:
729.733
jan 1, 2001
Maximum:
3.322K
jan 1, 1990
At the date of observation
Value
Absolute change
Change from previous value
jan 1, 1961
1.181K
+1.181K
0.0%
jan 1, 1962
1.232K
+51.338
4.35%
jan 1, 1963
1.236K
+3.667
0.3%
jan 1, 1964
1.353K
+117.344
9.5%
jan 1, 1965
920.417
-432.706
-31.98%
jan 1, 1966
1.17K
+249.356
27.09%
jan 1, 1967
1.364K
+194.351
16.61%
jan 1, 1968
1.195K
-168.682
-12.37%
jan 1, 1969
2.483K
+1.287K
107.67%
jan 1, 1970
2.604K
+121.011
4.87%
jan 1, 1971
1.716K
-887.414
-34.08%
jan 1, 1972
1.859K
+143.013
8.33%
jan 1, 1973
1.933K
+73.34
3.94%
jan 1, 1974
2.098K
+165.015
8.54%
jan 1, 1975
2.226K
+128.345
6.12%
jan 1, 1976
2.255K
+29.336
1.32%
jan 1, 1977
2.211K
-44.004
-1.95%
jan 1, 1978
2.354K
+143.013
6.47%
jan 1, 1979
2.461K
+106.343
4.52%
jan 1, 1980
2.783K
+322.696
13.11%
jan 1, 1981
2.439K
-344.698
-12.38%
jan 1, 1982
2.67K
+231.021
9.47%
jan 1, 1983
1.977K
-693.063
-25.96%
jan 1, 1984
2.963K
+986.423
49.91%
jan 1, 1985
2.871K
-91.675
-3.09%
jan 1, 1986
2.596K
-275.025
-9.58%
jan 1, 1987
2.318K
-278.692
-10.73%
jan 1, 1988
2.758K
+440.04
18.99%
jan 1, 1989
2.842K
+84.341
3.06%
jan 1, 1990
3.322K
+480.377
16.9%
jan 1, 1991
3.073K
-249.356
-7.51%
jan 1, 1992
2.838K
-234.688
-7.64%
jan 1, 1993
2.728K
-110.01
-3.88%
jan 1, 1994
2.519K
-209.019
-7.66%
jan 1, 1995
1.555K
-964.421
-38.28%
jan 1, 1996
2.006K
+451.041
29.01%
jan 1, 1997
2.197K
+190.684
9.51%
jan 1, 1998
1.837K
-359.366
-16.36%
jan 1, 1999
1.602K
-234.688
-12.77%
jan 1, 2000
1.302K
-300.694
-18.76%
jan 1, 2001
729.733
-572.052
-43.94%
jan 1, 2002
737.067
+7.334
1.01%
jan 1, 2003
795.739
+58.672
7.96%
jan 1, 2004
821.408
+25.669
3.23%
jan 1, 2005
997.424
+176.016
21.43%
jan 1, 2006
1.239K
+242.022
24.26%
jan 1, 2007
1.327K
+88.008
7.1%
jan 1, 2008
1.448K
+121.011
9.12%
jan 1, 2009
1.61K
+161.348
11.14%
jan 1, 2010
1.474K
-135.679
-8.43%
jan 1, 2011
1.727K
+253.023
17.16%
jan 1, 2012
2.222K
+495.045
28.66%
jan 1, 2013
2.34K
+117.344
5.28%
jan 1, 2014
2.538K
+198.018
8.46%
Ranking of countries by current statistics by years


Comments: