29
/
en
AIzaSyAYiBZKx7MnpbEhh9jyipgxe19OcubqV5w
April 1, 2024
264345
Togo
TGO
true
2
1
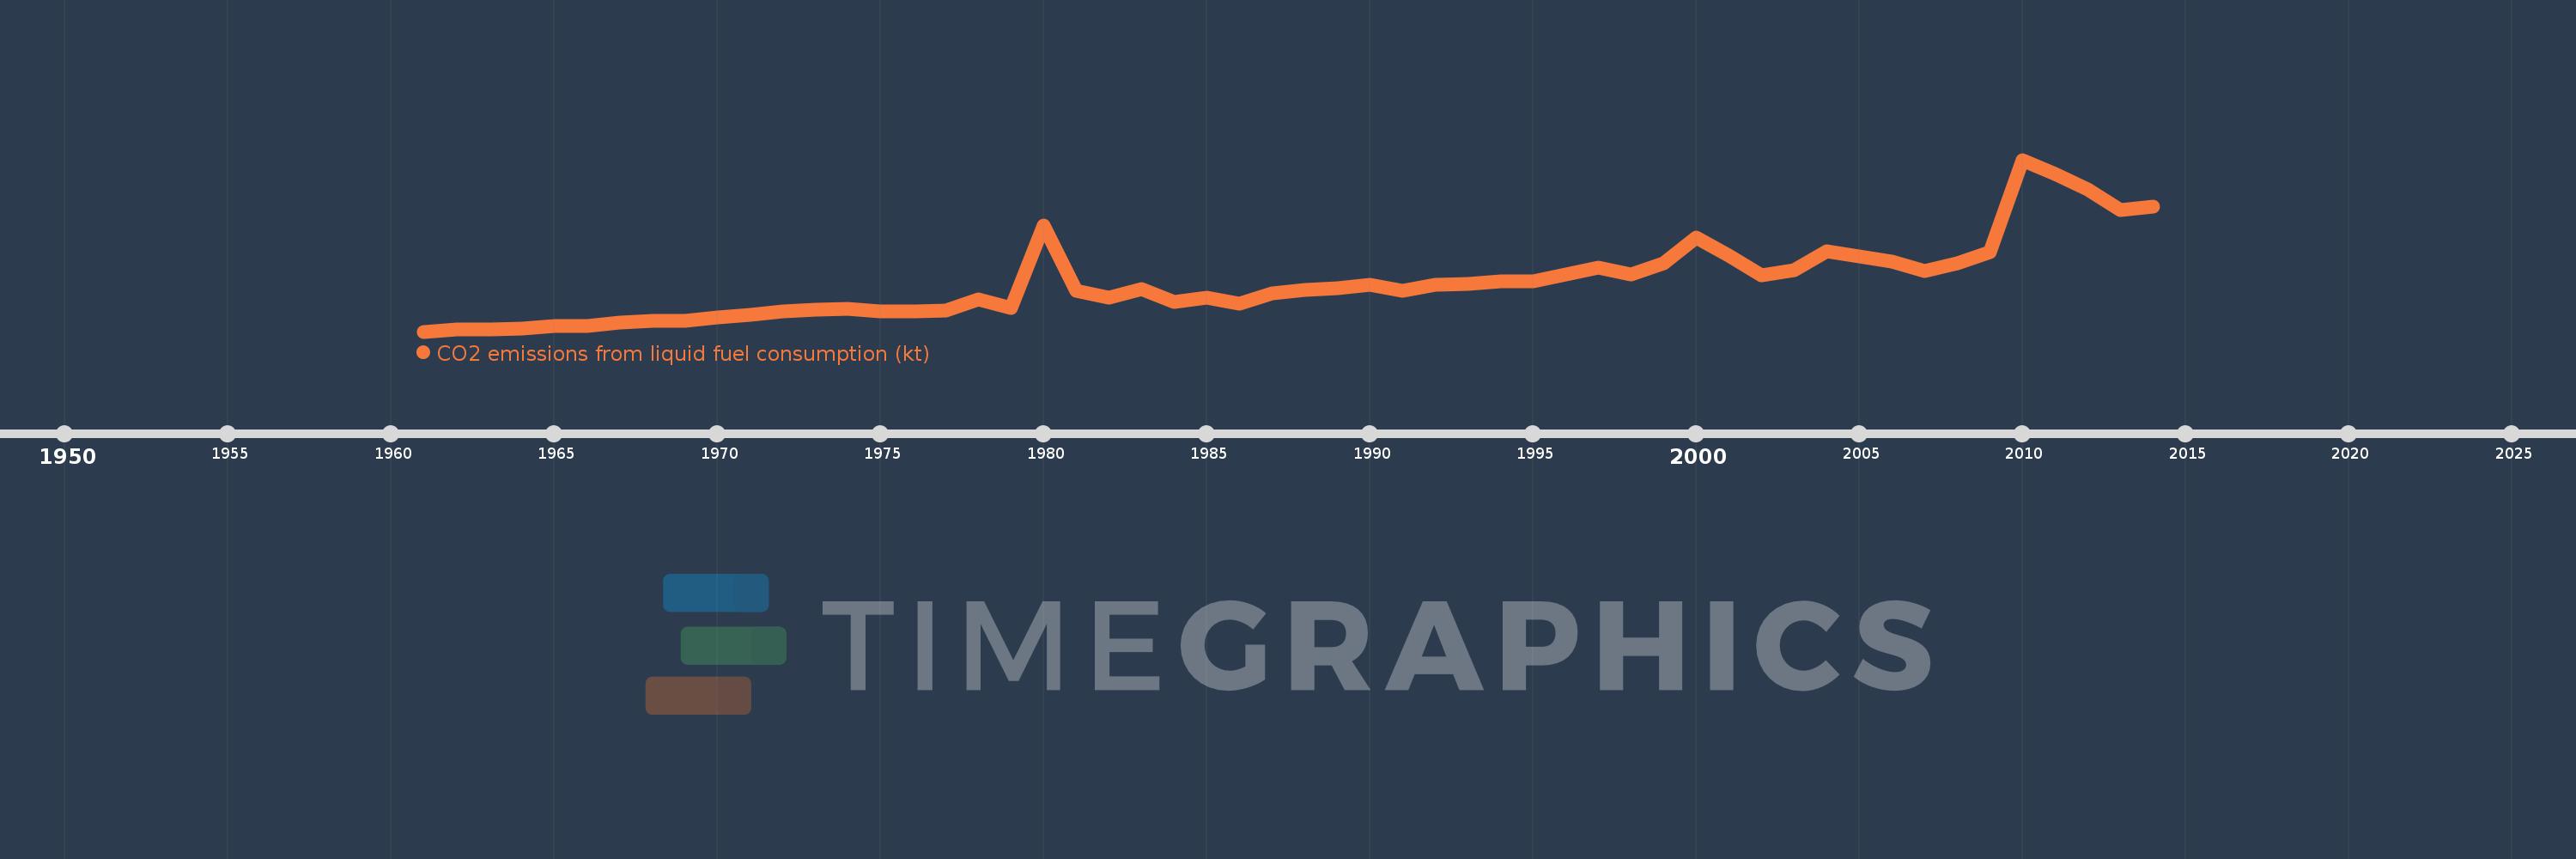
CO2 emissions from liquid fuel consumption (kt)
2014,2013,2012,2011,2010,2009,2008,2007,2006,2005,2004,2003,2002,2001,2000,1999,1998,1997,1996,1995,1994,1993,1992,1991,1990,1989,1988,1987,1986,1985,1984,1983,1982,1981,1980,1979,1978,1977,1976,1975,1974,1973,1972,1971,1970,1969,1968,1967,1966,1965,1964,1963,1962,1961
This statistics in other country:
AfghanistanAlbaniaAlgeriaAndorraAngolaAntigua and BarbudaArab WorldArgentinaArmeniaArubaAustraliaAustriaAzerbaijanBahamas, TheBahrainBangladeshBarbadosBelarusBelgiumBelizeBeninBermudaBhutanBoliviaBosnia and HerzegovinaBotswanaBrazilBritish Virgin IslandsBrunei DarussalamBulgariaBurkina FasoBurundiCabo VerdeCambodiaCameroonCanadaCaribbean small statesCayman IslandsCentral African RepublicCentral Europe and the BalticsChadChileChinaColombiaComorosCongo, Dem. Rep.Congo, Rep.Costa RicaCote d'IvoireCroatiaCubaCuracaoCyprusCzech RepublicDenmarkDjiboutiDominicaDominican RepublicEarly-demographic dividendEast Asia & PacificEast Asia & Pacific (excluding high income)East Asia & Pacific (IDA & IBRD countries)EcuadorEgypt, Arab Rep.El SalvadorEquatorial GuineaEritreaEstoniaEthiopiaEuro areaEurope & Central AsiaEurope & Central Asia (excluding high income)Europe & Central Asia (IDA & IBRD countries)European UnionFaroe IslandsFijiFinlandFragile and conflict affected situationsFranceFrench PolynesiaGabonGambia, TheGeorgiaGermanyGhanaGibraltarGreeceGreenlandGrenadaGuatemalaGuineaGuinea-BissauGuyanaHaitiHeavily indebted poor countries (HIPC)High incomeHondurasHong Kong SAR, ChinaHungaryIBRD onlyIcelandIDA & IBRD totalIDA blendIDA onlyIDA totalIndiaIndonesiaIran, Islamic Rep.IraqIrelandIsraelItalyJamaicaJapanJordanKazakhstanKenyaKiribatiKorea, Dem. People’s Rep.Korea, Rep.KuwaitKyrgyz RepublicLao PDRLate-demographic dividendLatin America & Caribbean Latin America & Caribbean (excluding high income)Latin America & the Caribbean (IDA & IBRD countries)LatviaLeast developed countries: UN classificationLebanonLesothoLiberiaLibyaLiechtensteinLithuaniaLow & middle incomeLow incomeLower middle incomeLuxembourgMacao SAR, ChinaMacedonia, FYRMadagascarMalawiMalaysiaMaldivesMaliMaltaMarshall IslandsMauritaniaMauritiusMexicoMicronesia, Fed. Sts.Middle East & North AfricaMiddle East & North Africa (excluding high income)Middle East & North Africa (IDA & IBRD countries)Middle incomeMoldovaMongoliaMontenegroMoroccoMozambiqueMyanmarNamibiaNauruNepalNetherlandsNew CaledoniaNew ZealandNicaraguaNigerNigeriaNorth AmericaNorwayOECD membersOmanOther small statesPacific island small statesPakistanPalauPanamaPapua New GuineaParaguayPeruPhilippinesPolandPortugalPost-demographic dividendPre-demographic dividendQatarRomaniaRussian FederationRwandaSamoaSao Tome and PrincipeSaudi ArabiaSenegalSerbiaSeychellesSierra LeoneSingaporeSint Maarten (Dutch part)Slovak RepublicSloveniaSmall statesSolomon IslandsSomaliaSouth AfricaSouth AsiaSouth Asia (IDA & IBRD)South SudanSpainSri LankaSt. Kitts and NevisSt. LuciaSt. Vincent and the GrenadinesSub-Saharan Africa Sub-Saharan Africa (excluding high income)Sub-Saharan Africa (IDA & IBRD countries)SudanSurinameSwazilandSwedenSwitzerlandSyrian Arab RepublicTajikistanTanzaniaThailandTimor-LesteTogoTongaTrinidad and TobagoTunisiaTurkeyTurkmenistanTurks and Caicos IslandsUgandaUkraineUnited Arab EmiratesUnited KingdomUnited StatesUpper middle incomeUruguayUzbekistanVanuatuVenezuela, RBVietnamWest Bank and GazaWorldYemen, Rep.ZambiaZimbabwe Timeline:
This timeline shows a graph from 1961 to 2014 of Togo. No data until 1960. Number of actual observations by date: 54.
Source name:
World Development Indicators
Source organization:
Carbon Dioxide Information Analysis Center, Environmental Sciences Division, Oak Ridge National Laboratory, Tennessee, United States.
Categories, topics:
Energy & Mining, Climate Change, Environment
Last updated:
apr 23, 2017
Indicators value changes by year
Minimum:
66.006
jan 1, 1961
Maximum:
2.197K
jan 1, 2010
At the date of observation
Value
Absolute change
Change from previous value
jan 1, 1961
66.006
+66.006
0.0%
jan 1, 1962
91.675
+25.669
38.89%
jan 1, 1963
88.008
-3.667
-4.0%
jan 1, 1964
106.343
+18.335
20.83%
jan 1, 1965
132.012
+25.669
24.14%
jan 1, 1966
132.012
0.0
0.0%
jan 1, 1967
179.683
+47.671
36.11%
jan 1, 1968
198.018
+18.335
10.2%
jan 1, 1969
194.351
-3.667
-1.85%
jan 1, 1970
242.022
+47.671
24.53%
jan 1, 1971
275.025
+33.003
13.64%
jan 1, 1972
315.362
+40.337
14.67%
jan 1, 1973
341.031
+25.669
8.14%
jan 1, 1974
344.698
+3.667
1.08%
jan 1, 1975
311.695
-33.003
-9.57%
jan 1, 1976
311.695
0.0
0.0%
jan 1, 1977
322.696
+11.001
3.53%
jan 1, 1978
462.042
+139.346
43.18%
jan 1, 1979
355.699
-106.343
-23.02%
jan 1, 1980
1.382K
+1.027K
288.66%
jan 1, 1981
568.385
-814.074
-58.89%
jan 1, 1982
484.044
-84.341
-14.84%
jan 1, 1983
594.054
+110.01
22.73%
jan 1, 1984
429.039
-165.015
-27.78%
jan 1, 1985
487.711
+58.672
13.68%
jan 1, 1986
407.037
-80.674
-16.54%
jan 1, 1987
535.382
+128.345
31.53%
jan 1, 1988
583.053
+47.671
8.9%
jan 1, 1989
605.055
+22.002
3.77%
jan 1, 1990
641.725
+36.67
6.06%
jan 1, 1991
575.719
-66.006
-10.29%
jan 1, 1992
649.059
+73.34
12.74%
jan 1, 1993
660.06
+11.001
1.69%
jan 1, 1994
689.396
+29.336
4.44%
jan 1, 1995
689.396
0.0
0.0%
jan 1, 1996
777.404
+88.008
12.77%
jan 1, 1997
854.411
+77.007
9.91%
jan 1, 1998
777.404
-77.007
-9.01%
jan 1, 1999
916.75
+139.346
17.92%
jan 1, 2000
1.236K
+319.029
34.8%
jan 1, 2001
1.012K
-223.687
-18.1%
jan 1, 2002
762.736
-249.356
-24.64%
jan 1, 2003
832.409
+69.673
9.13%
jan 1, 2004
1.063K
+231.021
27.75%
jan 1, 2005
997.424
-66.006
-6.21%
jan 1, 2006
938.752
-58.672
-5.88%
jan 1, 2007
821.408
-117.344
-12.5%
jan 1, 2008
913.083
+91.675
11.16%
jan 1, 2009
1.052K
+139.346
15.26%
jan 1, 2010
2.197K
+1.144K
108.71%
jan 1, 2011
2.021K
-176.016
-8.01%
jan 1, 2012
1.83K
-190.684
-9.44%
jan 1, 2013
1.577K
-253.023
-13.83%
jan 1, 2014
1.613K
+36.67
2.33%
Ranking of countries by current statistics by years


Comments: