29
/
en
AIzaSyAYiBZKx7MnpbEhh9jyipgxe19OcubqV5w
April 1, 2024
240535
Singapore
SGP
true
2
1
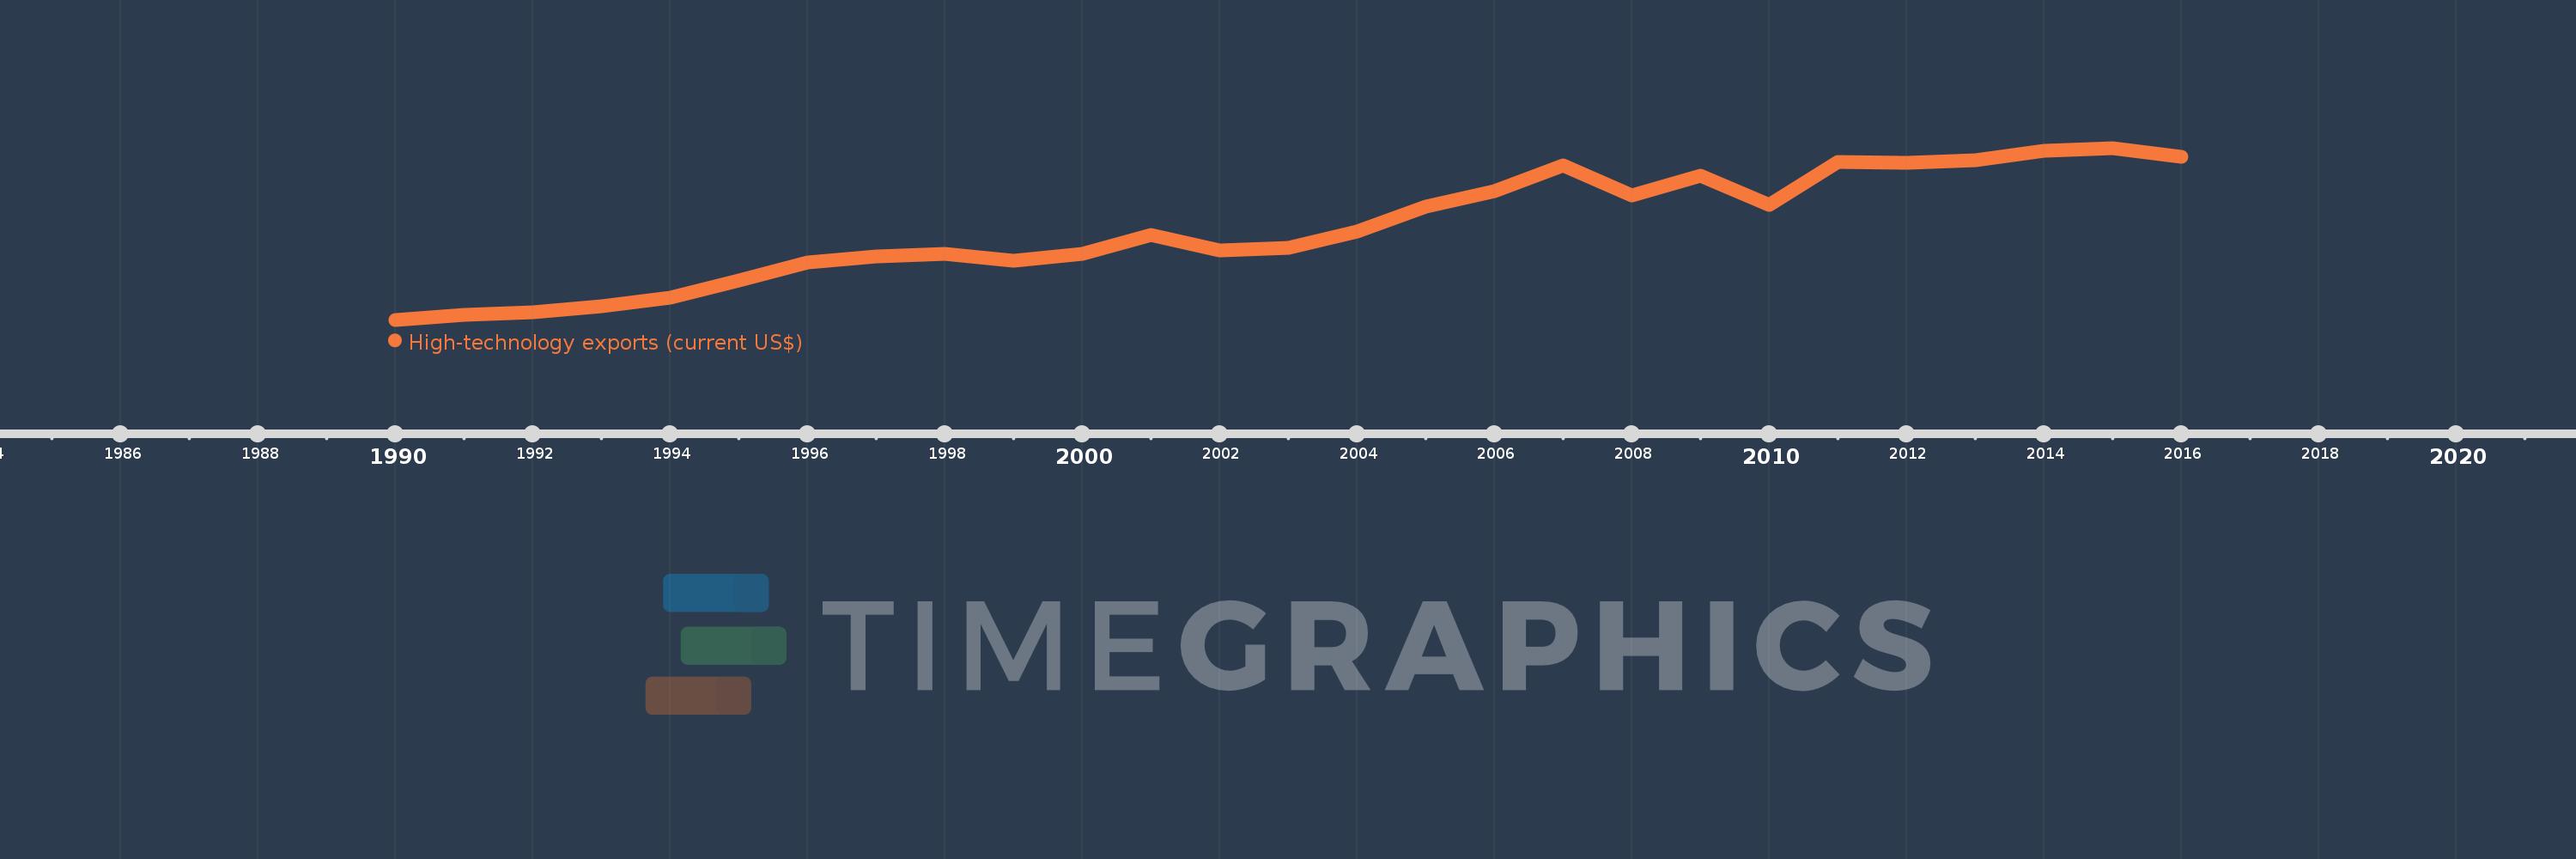
High-technology exports (current US$)
2016,2015,2014,2013,2012,2011,2010,2009,2008,2007,2006,2005,2004,2003,2002,2001,2000,1999,1998,1997,1996,1995,1994,1993,1992,1991,1990
This statistics in other country:
AlbaniaAlgeriaAndorraAntigua and BarbudaArab WorldArgentinaArmeniaArubaAustraliaAustriaAzerbaijanBahamas, TheBahrainBangladeshBarbadosBelarusBelgiumBelizeBeninBermudaBhutanBoliviaBosnia and HerzegovinaBotswanaBrazilBrunei DarussalamBulgariaBurkina FasoBurundiCabo VerdeCambodiaCameroonCanadaCaribbean small statesCentral African RepublicCentral Europe and the BalticsChileChinaColombiaComorosCongo, Rep.Costa RicaCote d'IvoireCroatiaCubaCyprusCzech RepublicDenmarkDjiboutiDominicaDominican RepublicEarly-demographic dividendEast Asia & PacificEcuadorEgypt, Arab Rep.El SalvadorEritreaEstoniaEthiopiaEuro areaEurope & Central AsiaEurope & Central Asia (excluding high income)Europe & Central Asia (IDA & IBRD countries)European UnionFaroe IslandsFijiFinlandFranceFrench PolynesiaGabonGambia, TheGeorgiaGermanyGhanaGreeceGreenlandGrenadaGuatemalaGuineaGuinea-BissauGuyanaHaitiHeavily indebted poor countries (HIPC)High incomeHondurasHong Kong SAR, ChinaHungaryIBRD onlyIcelandIDA & IBRD totalIDA blendIDA onlyIDA totalIndiaIndonesiaIran, Islamic Rep.IraqIrelandIsraelItalyJamaicaJapanJordanKazakhstanKenyaKiribatiKorea, Rep.KuwaitKyrgyz RepublicLate-demographic dividendLatin America & Caribbean Latin America & Caribbean (excluding high income)Latin America & the Caribbean (IDA & IBRD countries)LatviaLebanonLesothoLithuaniaLow & middle incomeLow incomeLower middle incomeLuxembourgMacao SAR, ChinaMacedonia, FYRMadagascarMalawiMalaysiaMaldivesMaliMaltaMauritiusMexicoMiddle East & North AfricaMiddle East & North Africa (excluding high income)Middle East & North Africa (IDA & IBRD countries)Middle incomeMoldovaMongoliaMontenegroMoroccoMozambiqueMyanmarNamibiaNepalNetherlandsNew CaledoniaNew ZealandNicaraguaNigerNigeriaNorth AmericaNorwayOECD membersOmanOther small statesPakistanPalauPanamaPapua New GuineaParaguayPeruPhilippinesPolandPortugalPost-demographic dividendQatarRomaniaRussian FederationRwandaSamoaSao Tome and PrincipeSaudi ArabiaSenegalSerbiaSeychellesSierra LeoneSingaporeSlovak RepublicSloveniaSmall statesSolomon IslandsSouth AfricaSouth AsiaSouth Asia (IDA & IBRD)South SudanSpainSri LankaSt. Kitts and NevisSt. LuciaSt. Vincent and the GrenadinesSub-Saharan Africa Sub-Saharan Africa (excluding high income)Sub-Saharan Africa (IDA & IBRD countries)SudanSurinameSwazilandSwedenSwitzerlandSyrian Arab RepublicTajikistanTanzaniaThailandTimor-LesteTogoTongaTrinidad and TobagoTunisiaTurkeyTurkmenistanTurks and Caicos IslandsTuvaluUgandaUkraineUnited Arab EmiratesUnited KingdomUnited StatesUpper middle incomeUruguayVanuatuVenezuela, RBVietnamWest Bank and GazaWorldYemen, Rep.ZambiaZimbabwe Timeline:
This timeline shows a graph from 1990 to 2016 of Singapore. No data until 1989. Number of actual observations by date: 27.
Source name:
World Development Indicators
Source organization:
United Nations, Comtrade database.
Categories, topics:
Private Sector, Science & Technology, Trade
Last updated:
apr 23, 2017
Indicators value changes by year
Minimum:
11.644 bln
jan 1, 1990
Maximum:
137.369 bln
jan 1, 2015
At the date of observation
Value
Absolute change
Change from previous value
jan 1, 1990
11.644 bln
+11.644 bln
0.0%
jan 1, 1991
15.023 bln
+3.379 bln
29.02%
jan 1, 1992
17.312 bln
+2.289 bln
15.23%
jan 1, 1993
21.773 bln
+4.461 bln
25.77%
jan 1, 1994
27.516 bln
+5.743 bln
26.38%
jan 1, 1995
40.314 bln
+12.798 bln
46.51%
jan 1, 1996
53.637 bln
+13.323 bln
33.05%
jan 1, 1997
58.001 bln
+4.364 bln
8.14%
jan 1, 1998
59.752 bln
+1.752 bln
3.02%
jan 1, 1999
54.895 bln
-4.858 bln
-8.13%
jan 1, 2000
60.031 bln
+5.136 bln
9.36%
jan 1, 2001
73.921 bln
+13.89 bln
23.14%
jan 1, 2002
62.553 bln
-11.368 bln
-15.38%
jan 1, 2003
64.12 bln
+1.567 bln
2.5%
jan 1, 2004
76.411 bln
+12.291 bln
19.17%
jan 1, 2005
94.225 bln
+17.814 bln
23.31%
jan 1, 2006
105.656 bln
+11.431 bln
12.13%
jan 1, 2007
124.739 bln
+19.083 bln
18.06%
jan 1, 2008
102.854 bln
-21.885 bln
-17.54%
jan 1, 2009
117.068 bln
+14.214 bln
13.82%
jan 1, 2010
95.398 bln
-21.67 bln
-18.51%
jan 1, 2011
126.982 bln
+31.583 bln
33.11%
jan 1, 2012
126.435 bln
-546.556 mln
-0.43%
jan 1, 2013
128.239 bln
+1.804 bln
1.43%
jan 1, 2014
135.602 bln
+7.362 bln
5.74%
jan 1, 2015
137.369 bln
+1.768 bln
1.3%
jan 1, 2016
130.989 bln
-6.38 bln
-4.64%
Ranking of countries by current statistics by years


Comments: