29
/
en
AIzaSyAYiBZKx7MnpbEhh9jyipgxe19OcubqV5w
April 1, 2024
129437
Estonia
EST
true
2
1
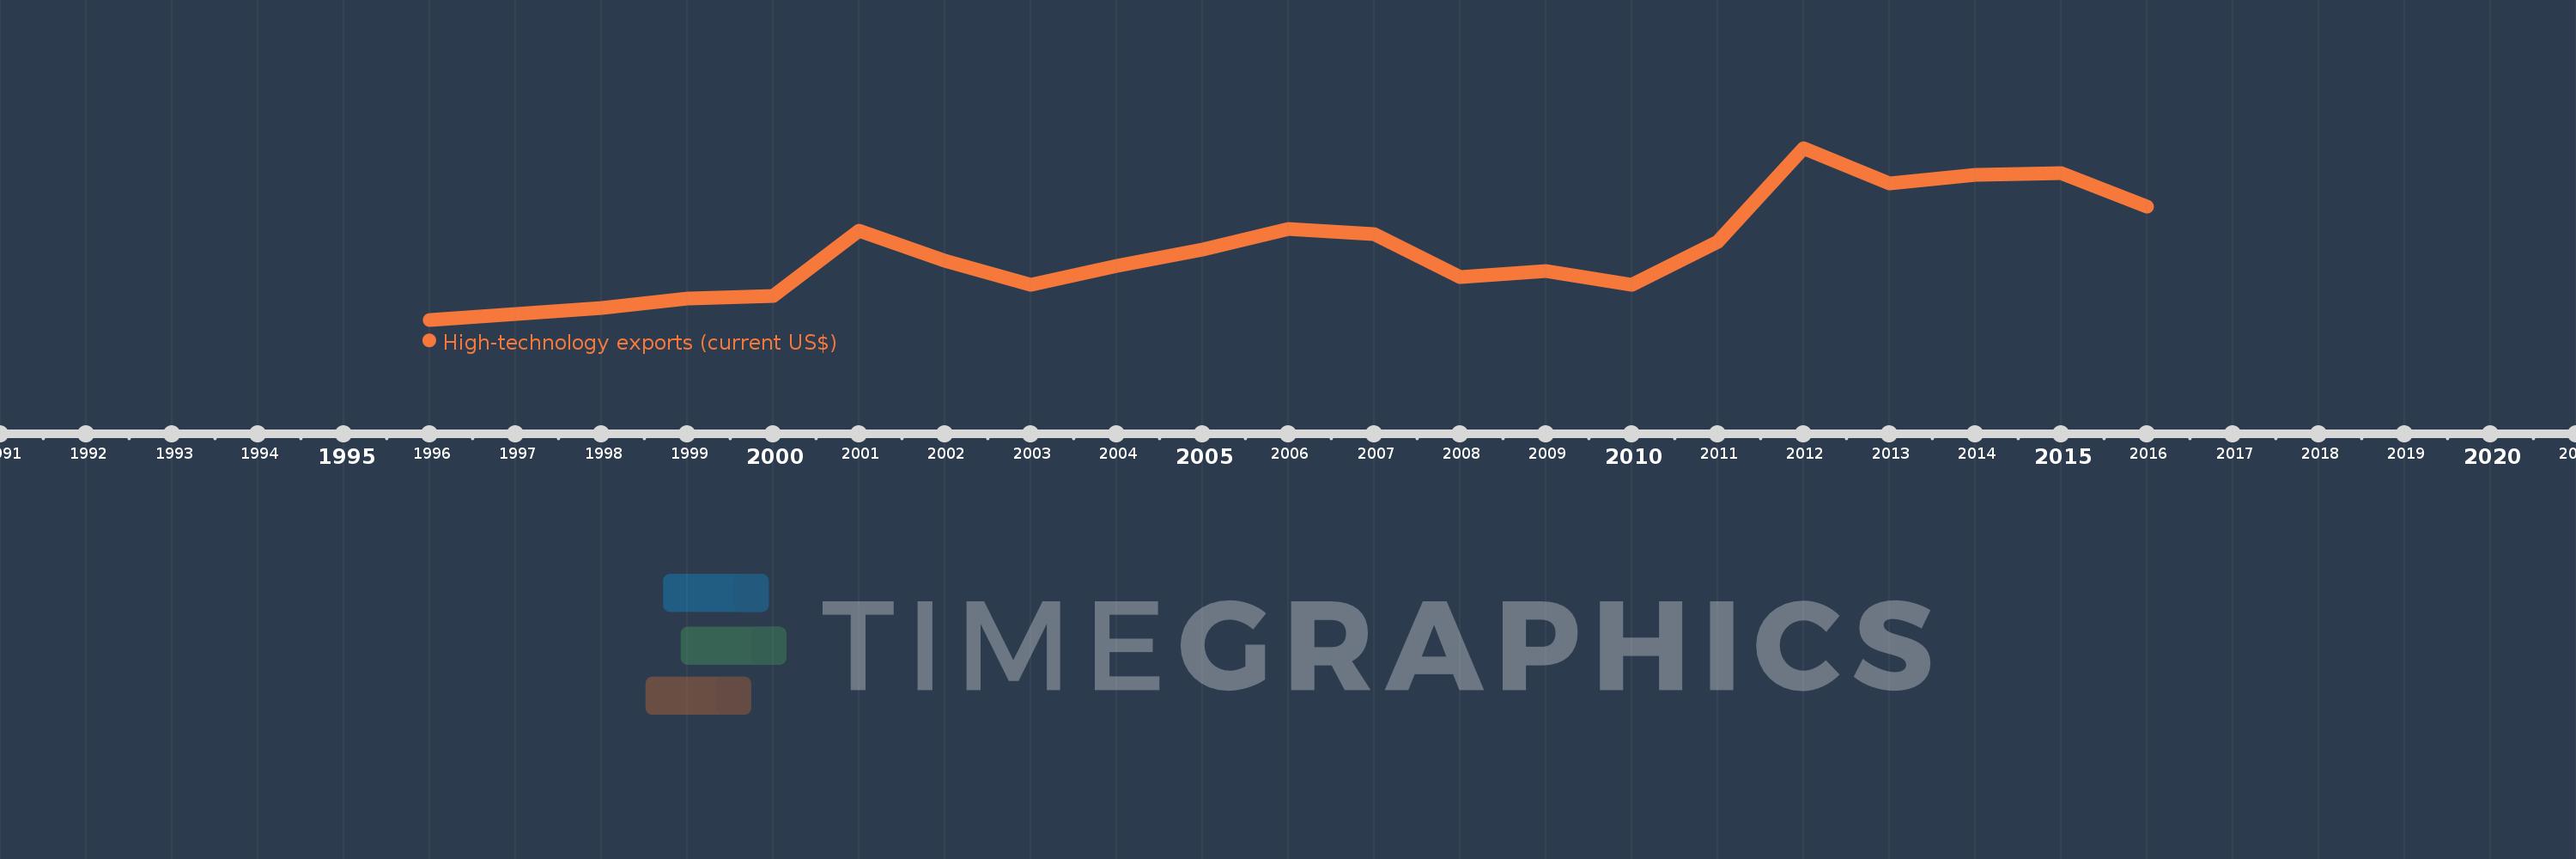
High-technology exports (current US$)
2016,2015,2014,2013,2012,2011,2010,2009,2008,2007,2006,2005,2004,2003,2002,2001,2000,1999,1998,1997,1996
This statistics in other country:
AlbaniaAlgeriaAndorraAntigua and BarbudaArab WorldArgentinaArmeniaArubaAustraliaAustriaAzerbaijanBahamas, TheBahrainBangladeshBarbadosBelarusBelgiumBelizeBeninBermudaBhutanBoliviaBosnia and HerzegovinaBotswanaBrazilBrunei DarussalamBulgariaBurkina FasoBurundiCabo VerdeCambodiaCameroonCanadaCaribbean small statesCentral African RepublicCentral Europe and the BalticsChileChinaColombiaComorosCongo, Rep.Costa RicaCote d'IvoireCroatiaCubaCyprusCzech RepublicDenmarkDjiboutiDominicaDominican RepublicEarly-demographic dividendEast Asia & PacificEcuadorEgypt, Arab Rep.El SalvadorEritreaEstoniaEthiopiaEuro areaEurope & Central AsiaEurope & Central Asia (excluding high income)Europe & Central Asia (IDA & IBRD countries)European UnionFaroe IslandsFijiFinlandFranceFrench PolynesiaGabonGambia, TheGeorgiaGermanyGhanaGreeceGreenlandGrenadaGuatemalaGuineaGuinea-BissauGuyanaHaitiHeavily indebted poor countries (HIPC)High incomeHondurasHong Kong SAR, ChinaHungaryIBRD onlyIcelandIDA & IBRD totalIDA blendIDA onlyIDA totalIndiaIndonesiaIran, Islamic Rep.IraqIrelandIsraelItalyJamaicaJapanJordanKazakhstanKenyaKiribatiKorea, Rep.KuwaitKyrgyz RepublicLate-demographic dividendLatin America & Caribbean Latin America & Caribbean (excluding high income)Latin America & the Caribbean (IDA & IBRD countries)LatviaLebanonLesothoLithuaniaLow & middle incomeLow incomeLower middle incomeLuxembourgMacao SAR, ChinaMacedonia, FYRMadagascarMalawiMalaysiaMaldivesMaliMaltaMauritiusMexicoMiddle East & North AfricaMiddle East & North Africa (excluding high income)Middle East & North Africa (IDA & IBRD countries)Middle incomeMoldovaMongoliaMontenegroMoroccoMozambiqueMyanmarNamibiaNepalNetherlandsNew CaledoniaNew ZealandNicaraguaNigerNigeriaNorth AmericaNorwayOECD membersOmanOther small statesPakistanPalauPanamaPapua New GuineaParaguayPeruPhilippinesPolandPortugalPost-demographic dividendQatarRomaniaRussian FederationRwandaSamoaSao Tome and PrincipeSaudi ArabiaSenegalSerbiaSeychellesSierra LeoneSingaporeSlovak RepublicSloveniaSmall statesSolomon IslandsSouth AfricaSouth AsiaSouth Asia (IDA & IBRD)South SudanSpainSri LankaSt. Kitts and NevisSt. LuciaSt. Vincent and the GrenadinesSub-Saharan Africa Sub-Saharan Africa (excluding high income)Sub-Saharan Africa (IDA & IBRD countries)SudanSurinameSwazilandSwedenSwitzerlandSyrian Arab RepublicTajikistanTanzaniaThailandTimor-LesteTogoTongaTrinidad and TobagoTunisiaTurkeyTurkmenistanTurks and Caicos IslandsTuvaluUgandaUkraineUnited Arab EmiratesUnited KingdomUnited StatesUpper middle incomeUruguayVanuatuVenezuela, RBVietnamWest Bank and GazaWorldYemen, Rep.ZambiaZimbabwe Timeline:
This timeline shows a graph from 1996 to 2016 of Estonia. No data until 1995. Number of actual observations by date: 21.
Source name:
World Development Indicators
Source organization:
United Nations, Comtrade database.
Categories, topics:
Private Sector, Science & Technology, Trade
Last updated:
apr 23, 2017
Indicators value changes by year
Minimum:
74.314 mln
jan 1, 1996
Maximum:
1.539 bln
jan 1, 2012
At the date of observation
Value
Absolute change
Change from previous value
jan 1, 1996
74.314 mln
+74.314 mln
0.0%
jan 1, 1997
125.367 mln
+51.054 mln
68.7%
jan 1, 1998
175.626 mln
+50.258 mln
40.09%
jan 1, 1999
256.96 mln
+81.334 mln
46.31%
jan 1, 2000
274.954 mln
+17.994 mln
7.0%
jan 1, 2001
834.649 mln
+559.695 mln
203.56%
jan 1, 2002
579.557 mln
-255.092 mln
-30.56%
jan 1, 2003
372.999 mln
-206.558 mln
-35.64%
jan 1, 2004
530.619 mln
+157.62 mln
42.26%
jan 1, 2005
669.725 mln
+139.106 mln
26.22%
jan 1, 2006
847.003 mln
+177.278 mln
26.47%
jan 1, 2007
804.865 mln
-42.138 mln
-4.97%
jan 1, 2008
440.671 mln
-364.194 mln
-45.25%
jan 1, 2009
490.025 mln
+49.354 mln
11.2%
jan 1, 2010
370.108 mln
-119.917 mln
-24.47%
jan 1, 2011
740.821 mln
+370.714 mln
100.16%
jan 1, 2012
1.539 bln
+798.585 mln
107.8%
jan 1, 2013
1.239 bln
-300.716 mln
-19.53%
jan 1, 2014
1.308 bln
+68.918 mln
5.56%
jan 1, 2015
1.328 bln
+20.816 mln
1.59%
jan 1, 2016
1.042 bln
-286.1 mln
-21.54%
Ranking of countries by current statistics by years


Comments: