29
/
en
AIzaSyAYiBZKx7MnpbEhh9jyipgxe19OcubqV5w
April 1, 2024
163849
Japan
JPN
true
2
1
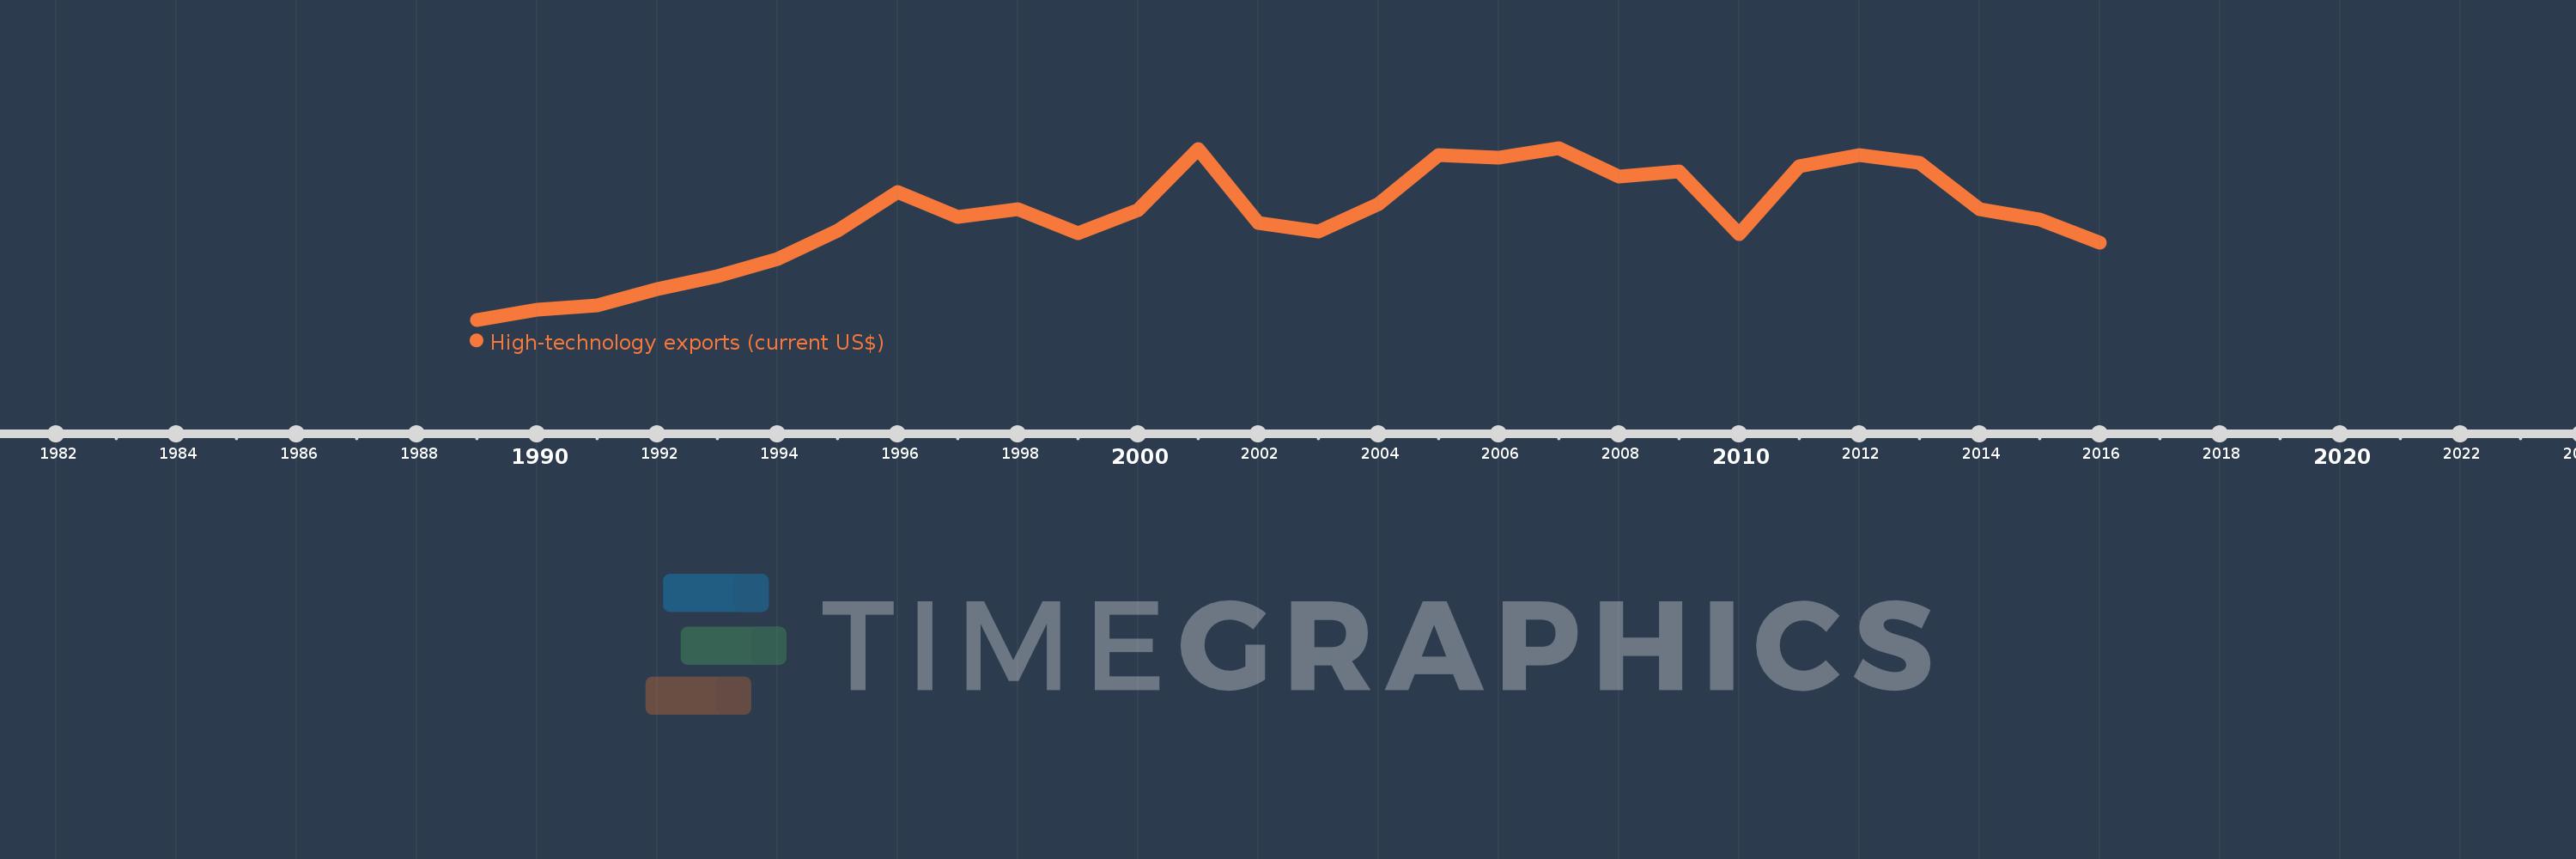
High-technology exports (current US$)
2016,2015,2014,2013,2012,2011,2010,2009,2008,2007,2006,2005,2004,2003,2002,2001,2000,1999,1998,1997,1996,1995,1994,1993,1992,1991,1990,1989
This statistics in other country:
AlbaniaAlgeriaAndorraAntigua and BarbudaArab WorldArgentinaArmeniaArubaAustraliaAustriaAzerbaijanBahamas, TheBahrainBangladeshBarbadosBelarusBelgiumBelizeBeninBermudaBhutanBoliviaBosnia and HerzegovinaBotswanaBrazilBrunei DarussalamBulgariaBurkina FasoBurundiCabo VerdeCambodiaCameroonCanadaCaribbean small statesCentral African RepublicCentral Europe and the BalticsChileChinaColombiaComorosCongo, Rep.Costa RicaCote d'IvoireCroatiaCubaCyprusCzech RepublicDenmarkDjiboutiDominicaDominican RepublicEarly-demographic dividendEast Asia & PacificEcuadorEgypt, Arab Rep.El SalvadorEritreaEstoniaEthiopiaEuro areaEurope & Central AsiaEurope & Central Asia (excluding high income)Europe & Central Asia (IDA & IBRD countries)European UnionFaroe IslandsFijiFinlandFranceFrench PolynesiaGabonGambia, TheGeorgiaGermanyGhanaGreeceGreenlandGrenadaGuatemalaGuineaGuinea-BissauGuyanaHaitiHeavily indebted poor countries (HIPC)High incomeHondurasHong Kong SAR, ChinaHungaryIBRD onlyIcelandIDA & IBRD totalIDA blendIDA onlyIDA totalIndiaIndonesiaIran, Islamic Rep.IraqIrelandIsraelItalyJamaicaJapanJordanKazakhstanKenyaKiribatiKorea, Rep.KuwaitKyrgyz RepublicLate-demographic dividendLatin America & Caribbean Latin America & Caribbean (excluding high income)Latin America & the Caribbean (IDA & IBRD countries)LatviaLebanonLesothoLithuaniaLow & middle incomeLow incomeLower middle incomeLuxembourgMacao SAR, ChinaMacedonia, FYRMadagascarMalawiMalaysiaMaldivesMaliMaltaMauritiusMexicoMiddle East & North AfricaMiddle East & North Africa (excluding high income)Middle East & North Africa (IDA & IBRD countries)Middle incomeMoldovaMongoliaMontenegroMoroccoMozambiqueMyanmarNamibiaNepalNetherlandsNew CaledoniaNew ZealandNicaraguaNigerNigeriaNorth AmericaNorwayOECD membersOmanOther small statesPakistanPalauPanamaPapua New GuineaParaguayPeruPhilippinesPolandPortugalPost-demographic dividendQatarRomaniaRussian FederationRwandaSamoaSao Tome and PrincipeSaudi ArabiaSenegalSerbiaSeychellesSierra LeoneSingaporeSlovak RepublicSloveniaSmall statesSolomon IslandsSouth AfricaSouth AsiaSouth Asia (IDA & IBRD)South SudanSpainSri LankaSt. Kitts and NevisSt. LuciaSt. Vincent and the GrenadinesSub-Saharan Africa Sub-Saharan Africa (excluding high income)Sub-Saharan Africa (IDA & IBRD countries)SudanSurinameSwazilandSwedenSwitzerlandSyrian Arab RepublicTajikistanTanzaniaThailandTimor-LesteTogoTongaTrinidad and TobagoTunisiaTurkeyTurkmenistanTurks and Caicos IslandsTuvaluUgandaUkraineUnited Arab EmiratesUnited KingdomUnited StatesUpper middle incomeUruguayVanuatuVenezuela, RBVietnamWest Bank and GazaWorldYemen, Rep.ZambiaZimbabwe Timeline:
This timeline shows a graph from 1989 to 2016 of Japan. No data until 1988. Number of actual observations by date: 28.
Source name:
World Development Indicators
Source organization:
United Nations, Comtrade database.
Categories, topics:
Private Sector, Science & Technology, Trade
Last updated:
apr 23, 2017
Indicators value changes by year
Minimum:
60.989 bln
jan 1, 1989
Maximum:
129.241 bln
jan 1, 2007
At the date of observation
Value
Absolute change
Change from previous value
jan 1, 1989
60.989 bln
+60.989 bln
0.0%
jan 1, 1990
64.899 bln
+3.91 bln
6.41%
jan 1, 1991
66.664 bln
+1.765 bln
2.72%
jan 1, 1992
73.206 bln
+6.541 bln
9.81%
jan 1, 1993
78.431 bln
+5.226 bln
7.14%
jan 1, 1994
85.018 bln
+6.587 bln
8.4%
jan 1, 1995
96.492 bln
+11.474 bln
13.5%
jan 1, 1996
111.84 bln
+15.348 bln
15.91%
jan 1, 1997
101.831 bln
-10.009 bln
-8.95%
jan 1, 1998
104.988 bln
+3.157 bln
3.1%
jan 1, 1999
95.492 bln
-9.496 bln
-9.05%
jan 1, 2000
104.65 bln
+9.159 bln
9.59%
jan 1, 2001
128.902 bln
+24.252 bln
23.17%
jan 1, 2002
99.451 bln
-29.451 bln
-22.85%
jan 1, 2003
95.885 bln
-3.566 bln
-3.59%
jan 1, 2004
107.083 bln
+11.198 bln
11.68%
jan 1, 2005
126.245 bln
+19.162 bln
17.89%
jan 1, 2006
125.445 bln
-799.849 mln
-0.63%
jan 1, 2007
129.241 bln
+3.796 bln
3.03%
jan 1, 2008
117.858 bln
-11.383 bln
-8.81%
jan 1, 2009
119.915 bln
+2.057 bln
1.75%
jan 1, 2010
95.159 bln
-24.756 bln
-20.64%
jan 1, 2011
122.102 bln
+26.944 bln
28.31%
jan 1, 2012
126.478 bln
+4.375 bln
3.58%
jan 1, 2013
123.393 bln
-3.084 bln
-2.44%
jan 1, 2014
105.076 bln
-18.318 bln
-14.85%
jan 1, 2015
100.955 bln
-4.121 bln
-3.92%
jan 1, 2016
91.514 bln
-9.441 bln
-9.35%
Ranking of countries by current statistics by years


Comments: